

Imperfect gold standards for kidney injury biomarker evaluation
- PMID: 22021710
- PMCID: PMC3695762
- DOI: 10.1681/ASN.2010111124
Imperfect gold standards for kidney injury biomarker evaluation
Abstract
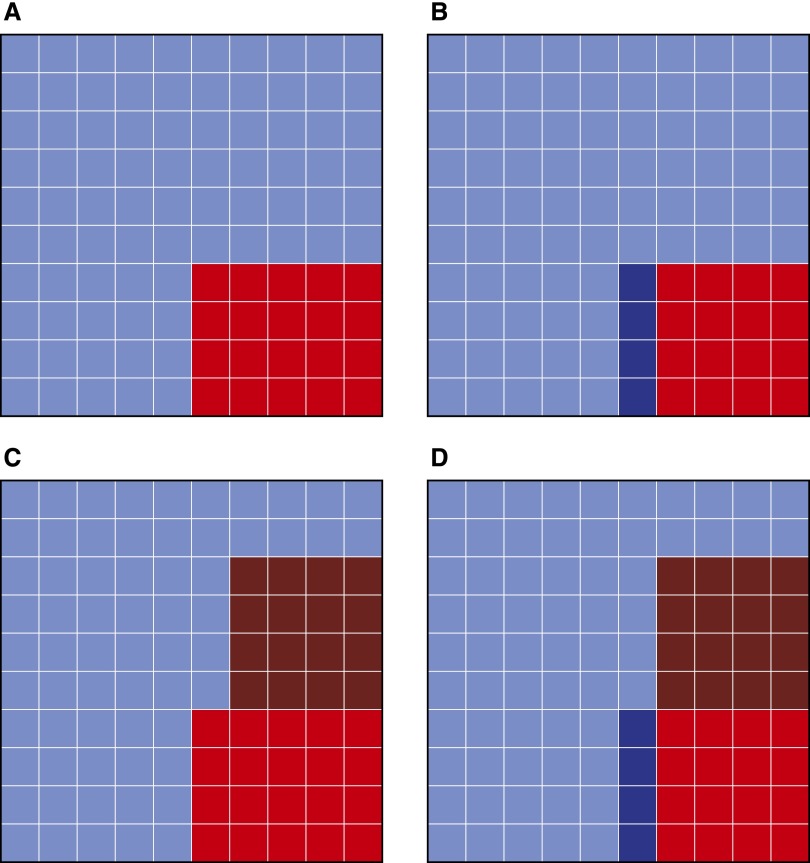
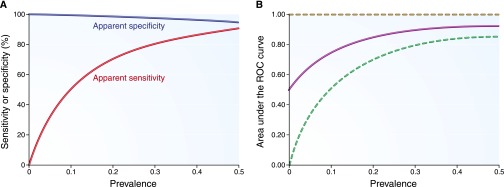
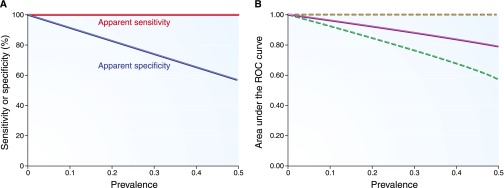
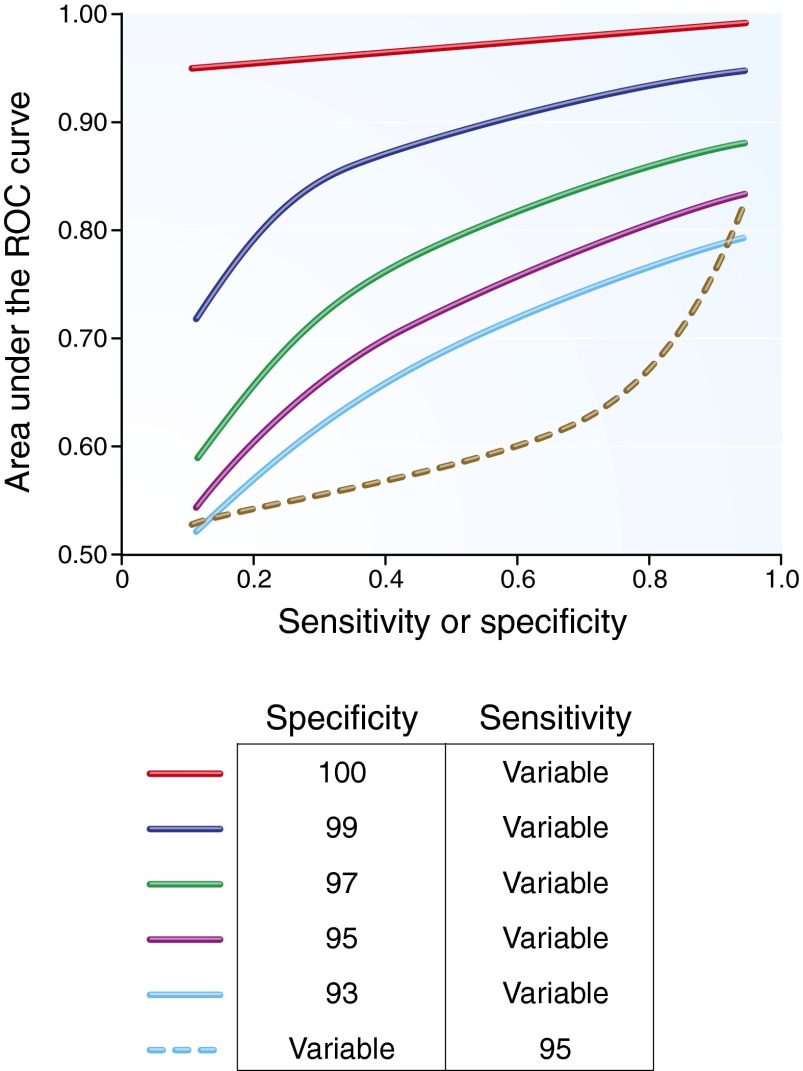
Clinicians have used serum creatinine in diagnostic testing for acute kidney injury for decades, despite its imperfect sensitivity and specificity. Novel tubular injury biomarkers may revolutionize the diagnosis of acute kidney injury; however, even if a novel tubular injury biomarker is 100% sensitive and 100% specific, it may appear inaccurate when using serum creatinine as the gold standard. Acute kidney injury, as defined by serum creatinine, may not reflect tubular injury, and the absence of changes in serum creatinine does not assure the absence of tubular injury. In general, the apparent diagnostic performance of a biomarker depends not only on its ability to detect injury, but also on disease prevalence and the sensitivity and specificity of the imperfect gold standard. Assuming that, at a certain cutoff value, serum creatinine is 80% sensitive and 90% specific and disease prevalence is 10%, a new perfect biomarker with a true 100% sensitivity may seem to have only 47% sensitivity compared with serum creatinine as the gold standard. Minimizing misclassification by using more strict criteria to diagnose acute kidney injury will reduce the error when evaluating the performance of a biomarker under investigation. Apparent diagnostic errors using a new biomarker may be a reflection of errors in the imperfect gold standard itself, rather than poor performance of the biomarker. The results of this study suggest that small changes in serum creatinine alone should not be used to define acute kidney injury in biomarker or interventional studies.
Figures
References
-
- Wade R, Eddy R, Shows TB, Kedes L: cDNA sequence, tissue-specific expression, and chromosomal mapping of the human slow-twitch skeletal muscle isoform of troponin I. Genomics 7: 346–357, 1990 - PubMed
-
- Antman EM, Tanasijevic MJ, Thompson B, Schactman M, McCabe CH, Cannon CP, Fischer GA, Fung AY, Thompson C, Wybenga D, Braunwald E: Cardiac-specific troponin I levels to predict the risk of mortality in patients with acute coronary syndromes. N Engl J Med 335: 1342–1349, 1996 - PubMed
-
- Hamm CW, Ravkilde J, Gerhardt W, Jørgensen P, Peheim E, Ljungdahl L, Goldmann B, Katus HA: The prognostic value of serum troponin T in unstable angina. N Engl J Med 327: 146–150, 1992 - PubMed
-
- Blantz RC: Pathophysiology of pre-renal azotemia. Kidney Int 53: 512–523, 1998 - PubMed
-
- Bosch JP, Saccaggi A, Lauer A, Ronco C, Belledonne M, Glabman S: Renal functional reserve in humans. Effect of protein intake on glomerular filtration rate. Am J Med 75: 943–950, 1983 - PubMed
Publication types
MeSH terms
Substances
Grants and funding
LinkOut - more resources
Full Text Sources
Other Literature Sources
