. 2011 Oct 21;334(6054):389-93.
doi: 10.1126/science.1207502.

Activity-dependent long-term depression of electrical synapses

Affiliations

Activity-dependent long-term depression of electrical synapses

Julie S Haas et al. Science. .

Abstract

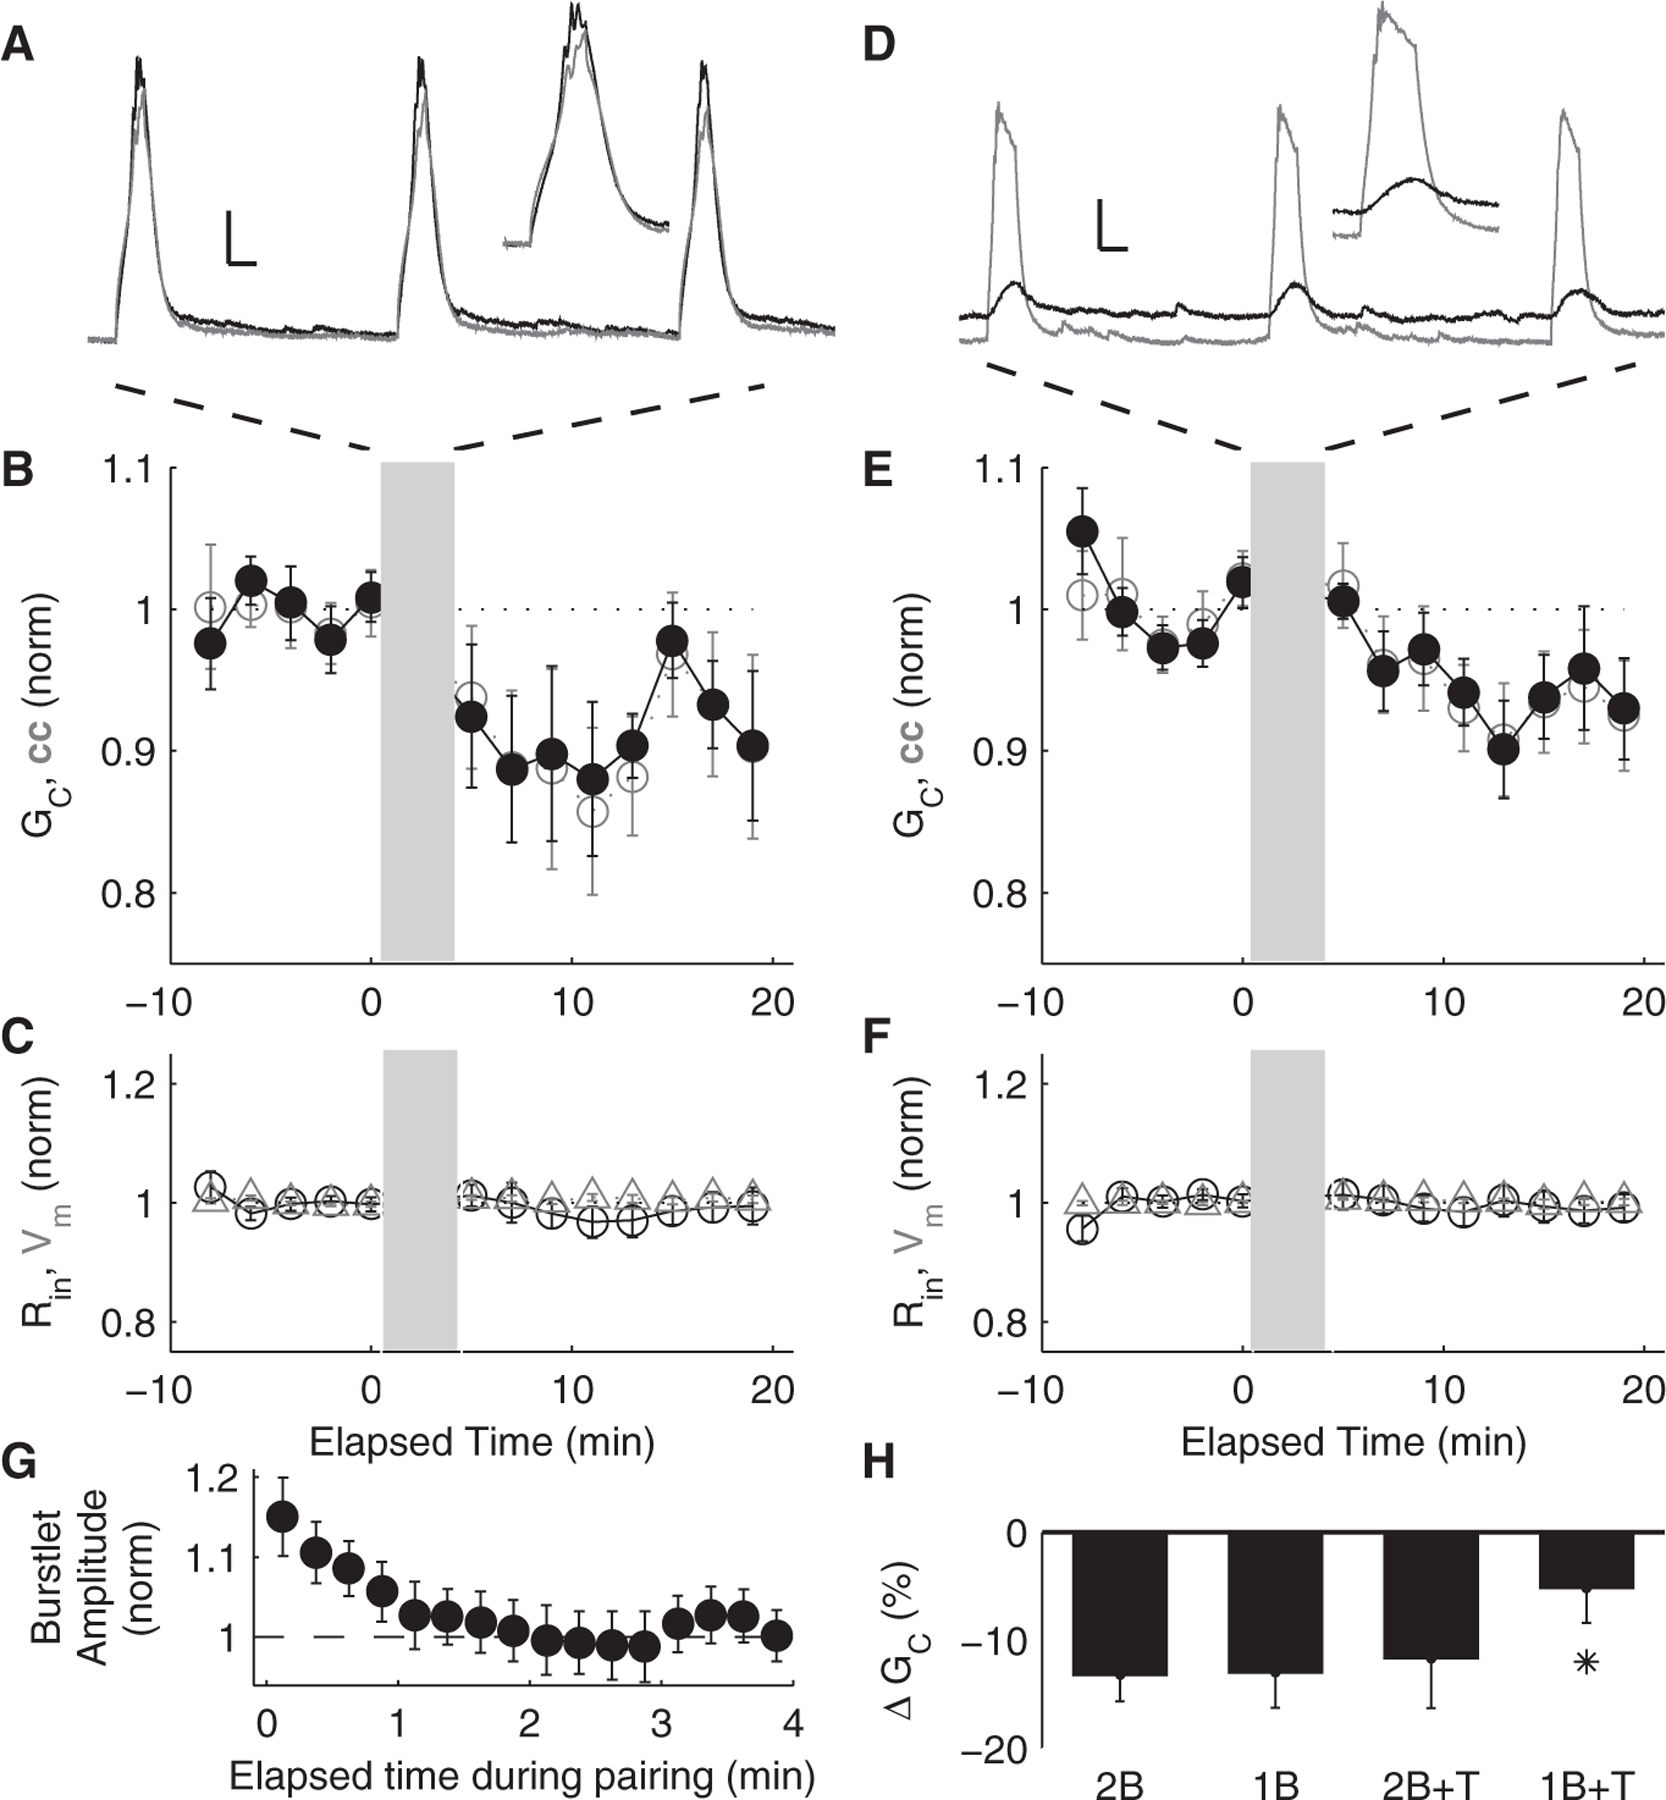
Use-dependent forms of synaptic plasticity have been extensively characterized at chemical synapses, but a relationship between natural activity and strength at electrical synapses remains elusive. The thalamic reticular nucleus (TRN), a brain area rich in gap-junctional (electrical) synapses, regulates cortical attention to the sensory surround and participates in shifts between arousal states; plasticity of electrical synapses may be a key mechanism underlying these processes. We observed long-term depression resulting from coordinated burst firing in pairs of coupled TRN neurons. Changes in gap-junctional communication were asymmetrical, indicating that regulation of connectivity depends on the direction of use. Modification of electrical synapses resulting from activity in coupled neurons is likely to be a widespread and powerful mechanism for dynamic reorganization of electrically coupled neuronal networks.


Figures

Fig. 1.
Fig. 1.
(A) Magnification 60× infrared image from patch recordings of a coupled pair of TRN neurons. (B) Current injection into one cell (I1) of a coupled pair drives a direct response in that cell (V1) and a gap junction–relayed response in the second cell (V2); cc12 = ΔV2V1. Scale bars, 5 mV, 0.1 s. (C) Mean electrical synaptic conductance (GC) plotted against mean cc (dots). Open circles are binned averages, with a slope of 7.9 [bin width, 0.02; coefficient of determination (r2) = 0.77]. (D) Directional cc (purple, scaled by 10) and GC (orange) for each pair; 12 represents coupling measured by current injection into cell 1, as in (B). (E) Coupling asymmetry was quantified by distribution of ratios (cc12/cc21 and G12/G21, larger value/smaller; bin width, 0.05). (F) Spikes driven by current injection into one cell (gray) caused spikes in the unstimulated coupled cell (black), as shown for three pairs with cc between 0.2 and 0.4 maintained at baseline Vm −65 mV. Scale bar, 25 mV, 0.1 s. (G) Wide-field image of TRN cells loaded with OGB-Bapta 1AM (Invitrogen, Carlsbad, California). (H) Stimulation of a patched cell (gray) drove bursting and strong calcium responses in that cell and in several neighboring cells (scale bars, 1% ΔF/F, 50 ms and 25 mV, 50 ms for bottom trace). Traces are from the cells labeled by color and number in (G).
Fig. 2.
Fig. 2.
(A) Paired bursting driven by simultaneous current injections into both cells of coupled pairs. Scale bars, 20 mV, 50 ms. (Inset) Close-up of paired burst event. (B) Mean cc and GC before and after paired bursting (gray bar). (C) Average normalized input resistance (Rin) and membrane potential (Vm) for the neurons summarized in (B). (D) Example paired responses before and after activity pairing as in (A). Scale bars, 100 ms, 2.5 mV (coupled response, in black), 5 mV (direct response, in gray). (E) Bursting driven by current injections into one cell of a coupled pair (gray trace) while the other neuron was quiescent (black trace). Scale bars, 20 mV, 50 ms. (Inset) Close-up of burst in cell 1 and burstlet in cell 2. (F) Mean cc and GC before and after single-cell bursting (gray bar). (G) Average normalized input resistance (Rin) and membrane potential (Vm) for the neurons summarized in (F). (H) Example paired responses before and after activity pairing as in (E). Scale bars, 100 ms, 2.5 mV (coupled response, in black), 5 mV (direct response, in gray).
Fig. 3.
Fig. 3.
(A) Paired bursting driven by simultaneous current injections into both cells of coupled pairs, in the presence of 1 μM TTX. Scale bars, 10 mV, 50 ms. (Inset) Close-up of paired burst events. (B) Mean cc and GC before and after paired bursting in TTX (gray bar). (C) Average normalized input resistance (Rin) and membrane potential (Vm) for the neurons summarized in (B). (D) Bursting driven by injections of current into one cell of a coupled pair (gray trace) while the other neuron was quiescent (black trace), also in TTX. Scale bars, 10 mV, 50 ms. (Inset) Close-up of burst event and burstlet. (E) Mean cc and GC before and after single-cell bursting in TTX (gray bar). (F) Average normalized input resistance (Rin) and membrane potential (Vm) for the neurons summarized in (E). (G) Burstlet amplitudes (from Fig. 2E) during single-cell activity plotted against elapsed time and normalized to final values. (H) Summary of changes in GC for the four paradigms: paired bursting (2B), single-cell bursting (1B), paired bursting in TTX (2B + T), and single-cell bursting in TTX (1B + T). Asterisk indicates significance (P < 0.05, ANOVA).
Fig. 4.
Fig. 4.
(A) For activity in cell 1, cc12 (blue) represents the “outbound” coupling measured with current injection into cell 1, and cc21 (green) represents “inbound” coupling. (B) Single-cell bursting in cell 1 (gray) with postsynaptic burstlets in cell 2. Scale bars, 15 mV, 25 ms. (C) Inbound cc21 before and after full bursts in cell 1. (D) Outbound cc12 before and after full bursts in cell 1. (E) Ratios of directional cc [black solid circles; division of the changes in (C) divided by the changes in (D) for each pair] and GC (open circles, P < 0.05 for both cc and GC) after full bursts in cell 1, plotted against initial values. (F) Bursts in cell1 (gray) in1 μM TTX. Scale bars, 10 mV, 25 ms. (G) Inbound cc21 before and after bursts in cell 1 in TTX. (H) Outbound cc12 before and after bursts in cell 1 in TTX. (I) Ratios of directional cc (red solid squares; P = 0.6) and GC (open squares; P = 0.76) after bursts in cell 1 in TTX, plotted against initial values. (J) Model of an asymmetrical gap junction as two parallel branches. RC represents the minimum conductance (maximum resistance) common to both sides of the gap junction, and RD represents additional, asymmetrical conductance in one direction.

Comment in

References

    1. Houser CR, Vaughn JE, Barber RP, Roberts E, Brain Res 200, 341 (1980). - PubMed
    1. Ohara PT, Lieberman AR, J. Neurocytol 14, 365 (1985). - PubMed
    1. Pinault D, Deschênes M, J. Comp. Neurol 391, 180 (1998). - PubMed
    1. Crick F, Proc. Natl. Acad. Sci. U.S.A 81, 4586 (1984). - PMC - PubMed
    1. McAlonan K, Cavanaugh J, Wurtz RH, J. Neurosci 26, 4444 (2006). - PMC - PubMed

Publication types