. 2012 Jan;33(1):10-9.
doi: 10.1093/carcin/bgr231. Epub 2011 Oct 21.

Regulation of Cdk7 activity through a phosphatidylinositol (3)-kinase/PKC-ι-mediated signaling cascade in glioblastoma

Affiliations

Regulation of Cdk7 activity through a phosphatidylinositol (3)-kinase/PKC-ι-mediated signaling cascade in glioblastoma

Shraddha R Desai et al. Carcinogenesis. 2012 Jan.

Abstract

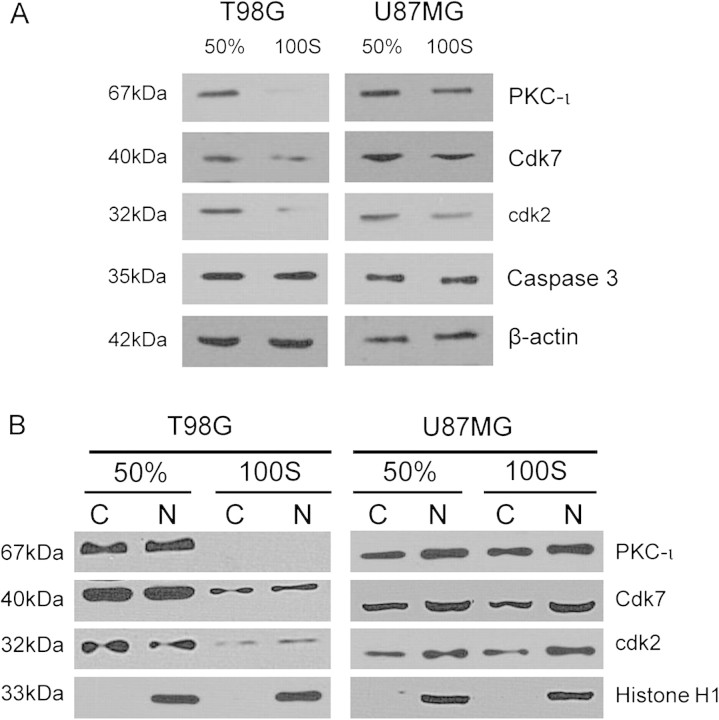
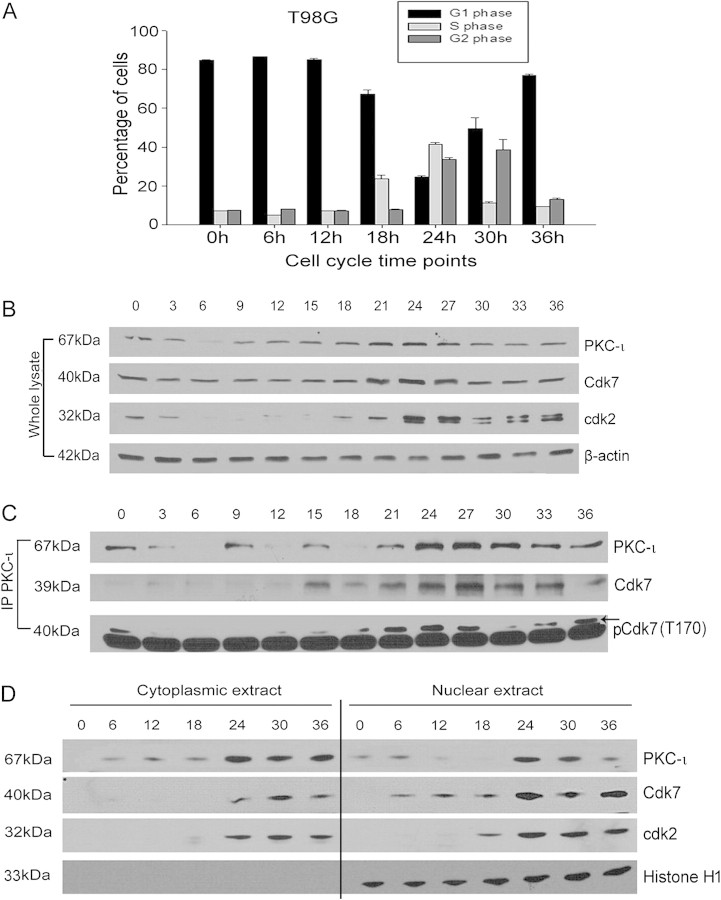
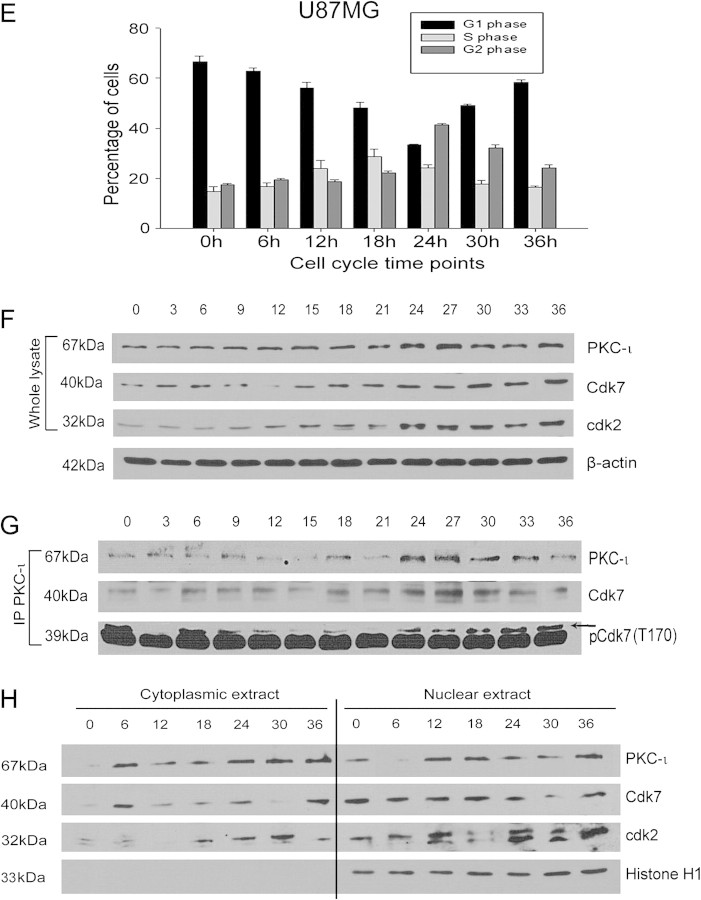
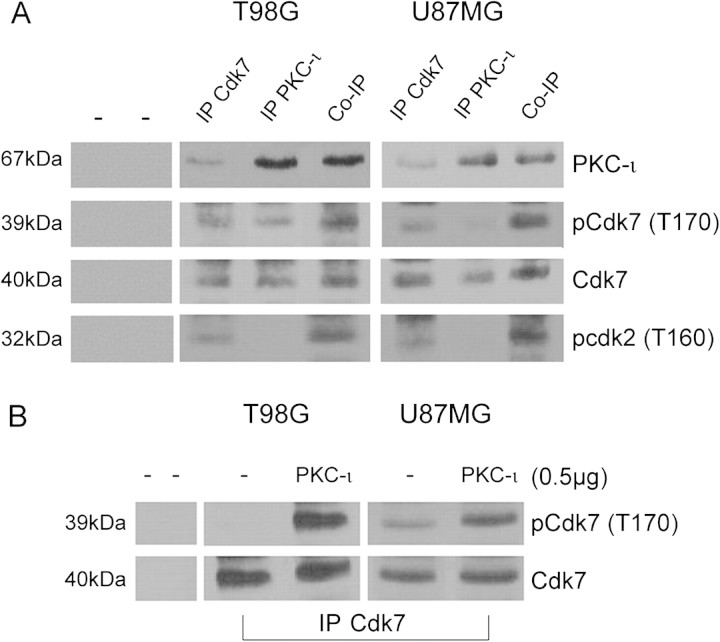
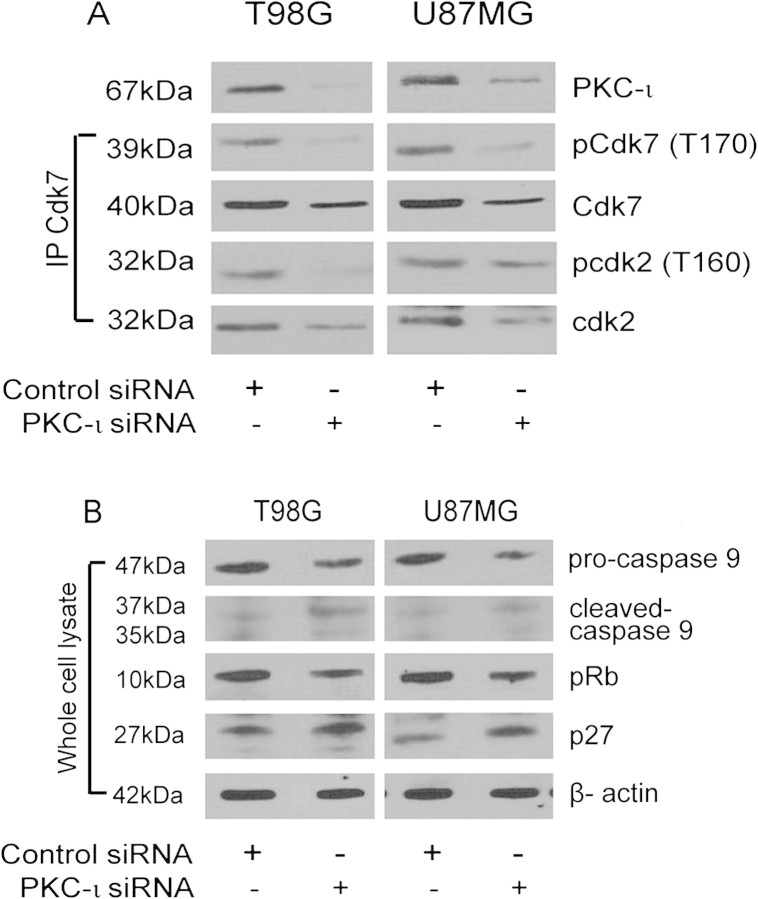
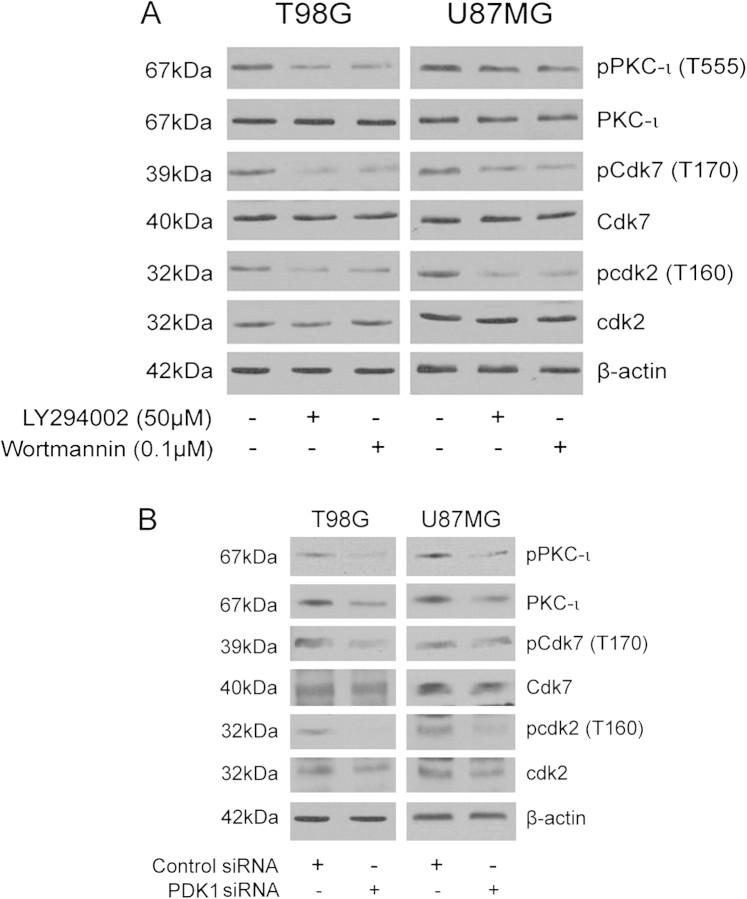
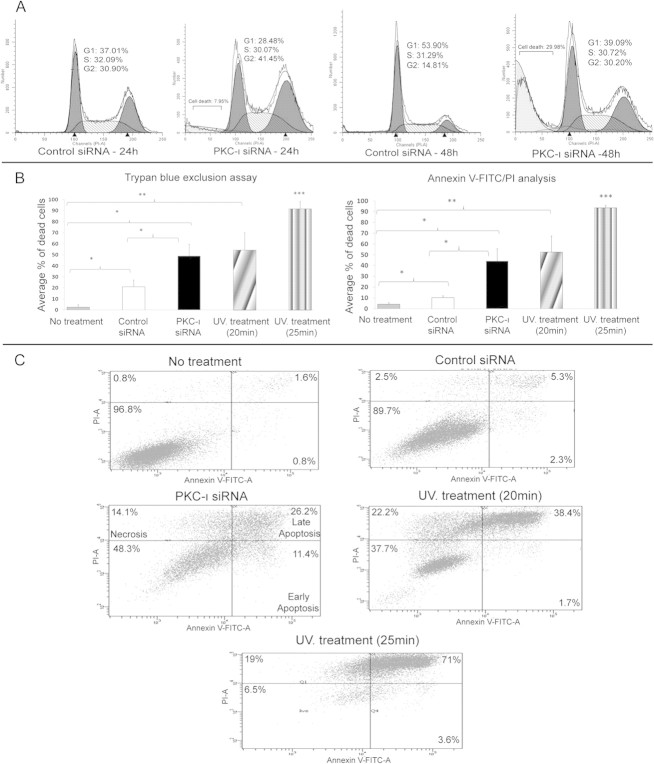
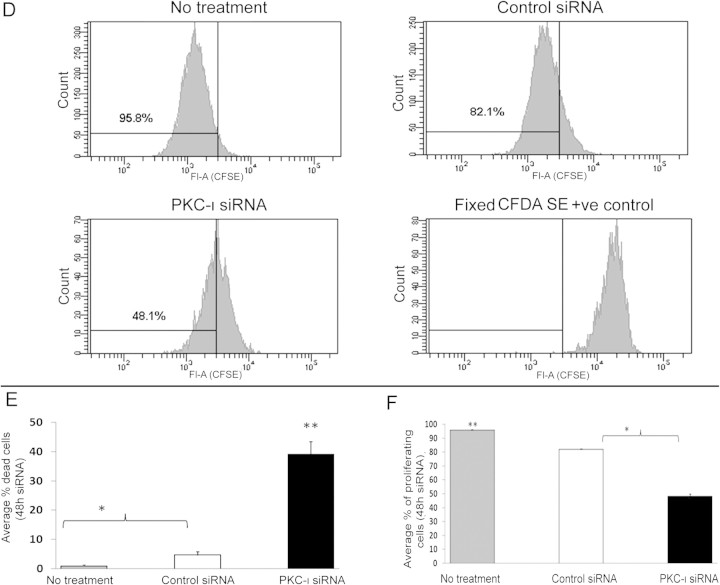
The objective of this research was to study the potential function of protein kinase C (PKC)-ι in cell cycle progression and proliferation in glioblastoma. PKC-ι is highly overexpressed in human glioma and benign and malignant meningioma; however, little is understood about its role in regulating cell proliferation of glioblastoma. Several upstream molecular aberrations and/or loss of PTEN have been implicated to constitutively activate the phosphatidylinositol (PI) (3)-kinase pathway. PKC-ι is a targeted mediator in the PI (3)-kinase signal transduction repertoire. Results showed that PKC-ι was highly activated and overexpressed in glioma cells. PKC-ι directly associated and phosphorylated Cdk7 at T170 in a cell cycle-dependent manner, phosphorylating its downstream target, cdk2 at T160. Cdk2 has a major role in inducing G(1)-S phase progression of cells. Purified PKC-ι phosphorylated both endogenous and exogenous Cdk7. PKC-ι downregulation reduced Cdk7 and cdk2 phosphorylation following PI (3)-kinase inhibition, phosphotidylinositol-dependent kinase 1 knockdown as well as PKC-ι silencing (by siRNA treatment). It also diminished cdk2 activity. PKC-ι knockdown inhibited overall proliferation rates and induced apoptosis in glioma cells. These findings suggest that glioma cells may be proliferating through a novel PI (3)-kinase-/PKC-ι/Cdk7/cdk2-mediated pathway.


Figures

Fig. 1.
Fig. 1.
Expression profile of PKC-ι, Cdk7 and Cdk2 in T98G and U87MG cells. (A) PKC-ι, Cdk7, cdk2 and caspase-3 expression levels in actively proliferating as well as contact inhibited plus serum-starved T98G and U87MG cells were determined by western blot analysis. β-actin was used as loading control. (B) Subcellular fractions of actively proliferating and contact inhibited plus serum-starved cells were subjected to western blot analysis was performed to determine the expression of PKC-ι, Cdk7 and cdk2. Histone H1 was used as the purity control for the nuclear fraction. Data are representative of N = 3 independent experiments.
Fig. 2.
Fig. 2.
Cell cycle progression and PKC-ι, Cdk7, cdk2 expression levels in T98G and U87MG cells. Briefly, T98G and U87MG cells were grown to 60–70% confluency followed by serum starvation for 48 h and subsequently serum stimulated for 36 h. Cells were harvested every 3 h and samples were prepared for total western blot. (A and E) Total expression of PKC-ι, Cdk7 and cdk2 were analyzed by western blotting of whole cell lysates from the indicated time points. β-actin was probed as a loading control. (B and F) Duplicate time point samples were prepared for cell cycle analysis. The histograms display the total DNA content in G1 phase (black bar), S phase (light gray bar) and G2 phase (dark gray bar). (C and G) PKC-ι was IP and its associated proteins were determined by western blot analysis by probing for pCdk7 (T170), total Cdk7 and PKC-ι. The first negative control (−) contains whole cell extract plus rabbit IgG whole molecule (50 μl of 1:1 vol/vol) and the second negative control (−) contains whole cell extract plus rabbit IgG whole molecule (50 μl) and normal rabbit IgG serum (5 μg). (D and H) Subfractionated samples (cytosolic and nuclear fraction) were subjected to western blot analysis to determine the expression of PKC-ι, Cdk7 and cdk2 at each time point. Histone H1 was used as the purity control for the nuclear fraction.
Fig. 2.
Fig. 2.
Cell cycle progression and PKC-ι, Cdk7, cdk2 expression levels in T98G and U87MG cells. Briefly, T98G and U87MG cells were grown to 60–70% confluency followed by serum starvation for 48 h and subsequently serum stimulated for 36 h. Cells were harvested every 3 h and samples were prepared for total western blot. (A and E) Total expression of PKC-ι, Cdk7 and cdk2 were analyzed by western blotting of whole cell lysates from the indicated time points. β-actin was probed as a loading control. (B and F) Duplicate time point samples were prepared for cell cycle analysis. The histograms display the total DNA content in G1 phase (black bar), S phase (light gray bar) and G2 phase (dark gray bar). (C and G) PKC-ι was IP and its associated proteins were determined by western blot analysis by probing for pCdk7 (T170), total Cdk7 and PKC-ι. The first negative control (−) contains whole cell extract plus rabbit IgG whole molecule (50 μl of 1:1 vol/vol) and the second negative control (−) contains whole cell extract plus rabbit IgG whole molecule (50 μl) and normal rabbit IgG serum (5 μg). (D and H) Subfractionated samples (cytosolic and nuclear fraction) were subjected to western blot analysis to determine the expression of PKC-ι, Cdk7 and cdk2 at each time point. Histone H1 was used as the purity control for the nuclear fraction.
Fig. 3.
Fig. 3.
PKC-ι induces direct phosphorylation of Cdk7. (A and B) the first negative control (−) contains whole cell extract plus rabbit IgG whole molecule (50 μl of 1:1 vol/vol) and the second negative control (−) contains whole cell extract plus rabbit IgG whole molecule (50 μl) and normal rabbit IgG serum (5 μg). (A) IP Cdk7, IP PKC-ι and co-IP from T98G and U87MG cells were subjected to kinase activity assay. Phosphorylation of Cdk7 at T170, pcdk2 at T160 and Pan Cdk7 were quantified using western blot analysis. (B) IP Cdk7 from both T98G and U87MG cells was incubated with active PKC-ι (0.5 μg) in an in vitro kinase activity assay. Western blot analysis was performed to determine phosphorylation of Cdk7 at T170, pcdk2 at T160, PKC-ι and Pan Cdk7.
Fig. 4.
Fig. 4.
PKC-ι silencing diminished Cdk7 and cdk2 phosphorylation. (A) Both T98G and U87MG cells were treated with either control siRNA or PKC-ι siRNA (100 nM) for 24 h. Subsequently, Cdk7 was IP and subjected to kinase activity assay followed by western blot to detect pCdk7 at T170, cdk2 at T160, total Cdk7 and total cdk2. (B) Whole cell lysate were from PKC-ι-silenced cells were analyzed by western blotting to detect Caspase 9, cleaved Caspase 9, pRb and p27kip1.
Fig. 5.
Fig. 5.
PKC-ι knockdown preceded a reduction in Cdk7 and cdk2 (A) Western blot analysis of T98G and U87MG cells for pPKC-ι (T555), pCdk7 (T170), pcdk2 (T160), Pan Cdk7, Pan cdk2 and PKC-ι following individual treatments for 2 h with LY294002 (50 μM) and Wortmannin (0.1 μM). (B) PDK1 knockdown (100 nM for 24 h) cells were analyzed by western blotting to detect phospho-PKC-ι (T555), total PKC-ι, phospho-Cdk7 (T170) phospho-cdk2 (T160), Pan Cdk7, Pan cdk2. Data are representative of three independent experiments.
Fig. 6.
Fig. 6.
PKC-ι depletion reduced cell proliferation and induced apoptosis in T98G cells. (A) The distribution pattern of cell cycle phases in PKC-ι knockdown cells is compared with control cells over 48 h treatment period. (B) Cell death induced by PKC-ι inhibition was detected using the Trypan blue exclusion method (left panel) and the Annexin V-FITC/PI assay (right panel). UV treatment was used as positive control for apoptosis detection. (C) The distribution pattern on cell death by PKC-ι knockdown was compared with control siRNA-treated and -untreated cells. UV treatment was used as positive control for apoptosis detection. Representative dot plots of the Annexin V/PI analysis for overall apoptotic rate, late apoptotic rate, early-apoptotic rate and necrotic rate. Experiments were repeated four times with a total N = 8 for all treatment groups. UV treatment groups had N = 3–5. The significance is explained in Table I for this data (D) Proliferation inhibition after PKC-ι silencing was assessed by the CFDA-SE dilution assay with live gate analysis. The proliferation rate of PKC-ι-silenced cells were compared with control siRNA-treated and -untreated cells. Fixed CFDA-SE stained cells were used as positive control. (E) PKC-ι-silenced cells and control cells were analyzed by 7-AAD staining to determine the average percentage of dead cells. (F) Average percentage of proliferating cells was measured by CFDA-SE dilution (examined from the Live Gate) from PKC-ι knockdown and control cells. The experiment was repeated twice with a total N = 4. *P < 0.05, Student’s t-test for specified treatment groups, **P < 0.05, Student’s t-test for all treatment groups.
Fig. 6.
Fig. 6.
PKC-ι depletion reduced cell proliferation and induced apoptosis in T98G cells. (A) The distribution pattern of cell cycle phases in PKC-ι knockdown cells is compared with control cells over 48 h treatment period. (B) Cell death induced by PKC-ι inhibition was detected using the Trypan blue exclusion method (left panel) and the Annexin V-FITC/PI assay (right panel). UV treatment was used as positive control for apoptosis detection. (C) The distribution pattern on cell death by PKC-ι knockdown was compared with control siRNA-treated and -untreated cells. UV treatment was used as positive control for apoptosis detection. Representative dot plots of the Annexin V/PI analysis for overall apoptotic rate, late apoptotic rate, early-apoptotic rate and necrotic rate. Experiments were repeated four times with a total N = 8 for all treatment groups. UV treatment groups had N = 3–5. The significance is explained in Table I for this data (D) Proliferation inhibition after PKC-ι silencing was assessed by the CFDA-SE dilution assay with live gate analysis. The proliferation rate of PKC-ι-silenced cells were compared with control siRNA-treated and -untreated cells. Fixed CFDA-SE stained cells were used as positive control. (E) PKC-ι-silenced cells and control cells were analyzed by 7-AAD staining to determine the average percentage of dead cells. (F) Average percentage of proliferating cells was measured by CFDA-SE dilution (examined from the Live Gate) from PKC-ι knockdown and control cells. The experiment was repeated twice with a total N = 4. *P < 0.05, Student’s t-test for specified treatment groups, **P < 0.05, Student’s t-test for all treatment groups.

Similar articles

Cited by

References

    1. Parlato C, et al. Surgery, radiotherapy and temozolomide in treating high-grade gliomas. Front. Biosci. 2006;11:1280–1283. - PubMed
    1. Stupp R, et al. Radiotherapy plus concomitant and adjuvant temozolomide for glioblastoma. N. Engl. J. Med. 2005;352:987–996. - PubMed
    1. Xiao H, et al. The identification of four protein kinase C isoforms in human glioblastoma cell line: PKC alpha, gamma, epsilon and zeta. J. Neurosurg. 1994;81:734–740. - PubMed
    1. Couldwell W, et al. Inhibition of growth of established human glioma cell lines by modulators of the protein kinase C system. J. Neurosurg. 1990;73:594–600. - PubMed
    1. Inoue M, et al. Studies on cyclic nucleotide-independent protein kinase and its proenzyme in mammalian tissues. II. Proenzyme and its activation by calcium—dependent protease from rat brain. J. Biol. Chem. 1977;252:7610–7616. - PubMed

Publication types

MeSH terms

Substances