

A peptide filtering relation quantifies MHC class I peptide optimization
- PMID: 22022238
- PMCID: PMC3195949
- DOI: 10.1371/journal.pcbi.1002144
A peptide filtering relation quantifies MHC class I peptide optimization
Abstract
Major Histocompatibility Complex (MHC) class I molecules enable cytotoxic T lymphocytes to destroy virus-infected or cancerous cells, thereby preventing disease progression. MHC class I molecules provide a snapshot of the contents of a cell by binding to protein fragments arising from intracellular protein turnover and presenting these fragments at the cell surface. Competing fragments (peptides) are selected for cell-surface presentation on the basis of their ability to form a stable complex with MHC class I, by a process known as peptide optimization. A better understanding of the optimization process is important for our understanding of immunodominance, the predominance of some T lymphocyte specificities over others, which can determine the efficacy of an immune response, the danger of immune evasion, and the success of vaccination strategies. In this paper we present a dynamical systems model of peptide optimization by MHC class I. We incorporate the chaperone molecule tapasin, which has been shown to enhance peptide optimization to different extents for different MHC class I alleles. Using a combination of published and novel experimental data to parameterize the model, we arrive at a relation of peptide filtering, which quantifies peptide optimization as a function of peptide supply and peptide unbinding rates. From this relation, we find that tapasin enhances peptide unbinding to improve peptide optimization without significantly delaying the transit of MHC to the cell surface, and differences in peptide optimization across MHC class I alleles can be explained by allele-specific differences in peptide binding. Importantly, our filtering relation may be used to dynamically predict the cell surface abundance of any number of competing peptides by MHC class I alleles, providing a quantitative basis to investigate viral infection or disease at the cellular level. We exemplify this by simulating optimization of the distribution of peptides derived from Human Immunodeficiency Virus Gag-Pol polyprotein.
Conflict of interest statement
The authors have declared that no competing interests exist.
Figures
 are shown explicitly.
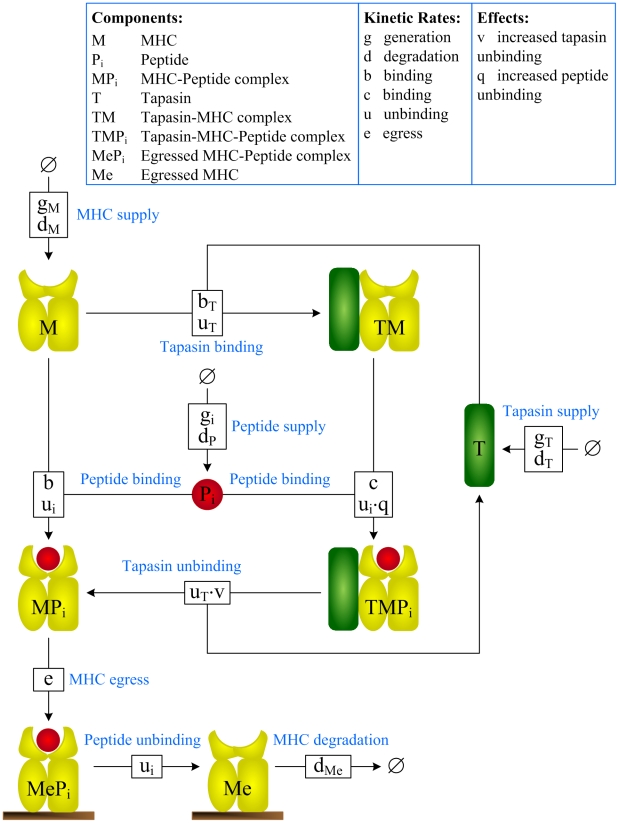
 (see Methods for the full reaction set).
 and generation rate
  for each peptide
  , and a separate peptide binding rate
  for each HLA–B allele
  (Table S1 in Text S1; Protocol S1).
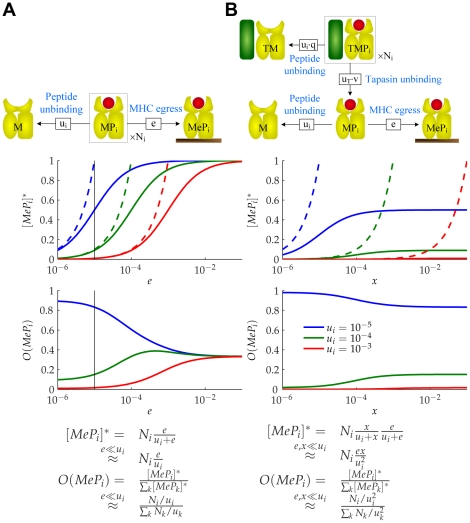
 MHC complexes containing peptides with off-rate
  .
.  denotes the expected number of MHC complexes that will egress before the peptide can escape.
  denotes the expected proportion of egressed MHC complexes that will contain peptides with off-rate
  . This defines a measure of peptide optimization. We plot
  and
and  as functions of
  for three peptides with different off-rates and the same initial populations. Maximal optimization is achieved when
  , with
  (dashed lines). (B) Consider a population of
  tapasin-MHC complexes containing peptides with off-rate
  .
.  denotes the expected number of MHC complexes that will unbind from tapasin and egress before the peptide can escape, where
  .
.  is defined as in A. We plot
  and
and  as functions of
  with
with  (black line in A). Maximal optimization is achieved when
  , with
  .
.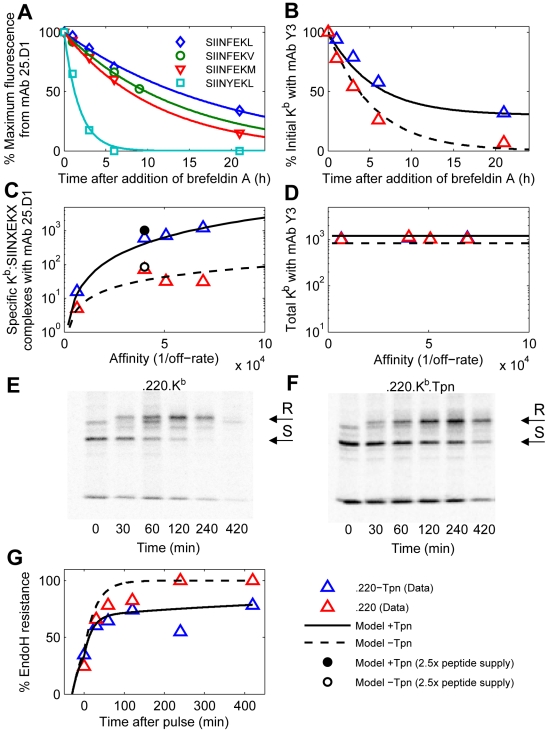
 The model of Fig. 2 was calibrated for H2−
 by varying the rates of peptide binding, MHC degradation at the cell surface, and egress (Table S2 in Text S1; Protocol S2). Each simulation computes the steady state of the model with three types of peptide: two background peptides
  and
and  and one of the four SIINFEKL peptide variants
  (
( estimated from data in panel A). (A) Release of peptides from MHC following treatment with brefeldin A (BFA) measured with 25.D1 (symbols), fitted to single exponential decays (solid lines). (B) Dissociation of endogenous peptides from cells treated with BFA. (C) Steady-state presentation of specific peptide-MHC complexes at the cell surface, comparing simulation with measurements of 25.D1 from . (D) Total steady-state peptide-MHC complexes (cell surface), comparing simulation with measurements of Y3 from . Simulated values were scaled by a proportionality factor for optimally overlapping the 25.D1 data (with SIINFEKM removed) and the Y3 data (all points) (Text S1). (B–D) The x-axis shows the relative affinity of peptides given by the inverse of the off-rate. Steady state concentrations were obtained by equating the right hand sides of the ODEs to zero. Steady state concentrations in tapasin-deficient cells were simulated by setting
  . (E–G) For quantifying egression of peptide-MHC complexes, .220.
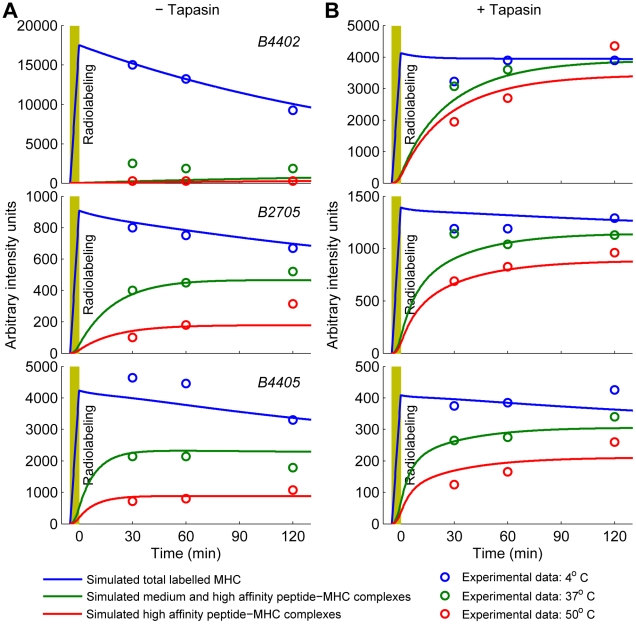
 (E) and .220.
 .Tpn (F) were pulsed for 10 min with
  -Met/Cys and chased for the indicated times (min). Y3 immunoprecipitates were digested with endoglycosidase-H (EndoH) and SDS-PAGE and autoradiography were performed. Arrows indicate
  heavy chain resistant (R) and sensitive (S) to EndoH digestion. EndoH analysis of H2−
 was performed as described previously . (B–D, G) The solid lines indicate model simulations and triangles indicate measured data-points. The experimental data for (A,B,E–F) is novel, while the experimental data for (C,D) is from .
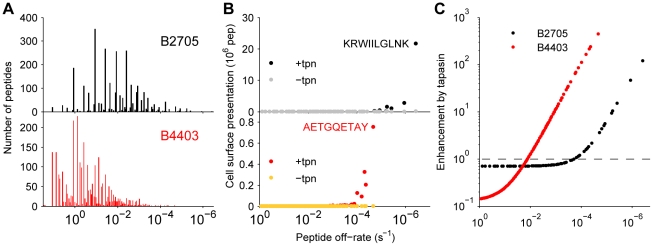
 , where
  is the off-rate of the peptide from MHC (Fig. 5). However, the characteristics of the MHC allele, such as the allele-specific peptide on-rate, can significantly alter the effect of tapasin on the presentation of a given peptide. Our model allows differences in presentation levels to be quantified by taking into account peptide supply and peptide off-rate, together with the effects of tapasin and the binding properties of the MHC class I allele under consideration. In particular, our analysis of the HIV-1 Gag-Pol polyprotein provides a specific quantitative prediction for the cell surface presentation of the immunodominant KRWIILGLNK by HLA–B2705. By simulating the range of peptides derived from Gag-Pol, representing a range of off-rates, we observe that the enhancement by tapasin is independent of peptide supply, instead being wholly determined by the peptide off- and on-rates (Fig. 7 C).
References
-
- Yewdell JW, Bennink JR. Immunodominance in major histocompatibility complex class I-restricted T lymphocyte responses. Ann Rev of Immunol. 1999;17:51–88. - PubMed
-
- Yewdell JW, Reits E, Neefjes J. Making sense of mass destruction: quantitating MHC class I antigen presentation. Nat Rev Immunol. 2003;3:952–961. - PubMed
-
- Elliott T, Williams A. The optimization of peptide cargo bound to MHC class I molecules by the peptide-loading complex. Immunol Rev. 2005;207:89–99. - PubMed
-
- Wright CA, Kozik P, Zacharias M, Springer S. Tapasin and other chaperones: models of the MHC class I loading complex. Biol Chem. 2004;385:763–778. - PubMed
Publication types
MeSH terms
Substances
Grants and funding
LinkOut - more resources
Full Text Sources
Research Materials
