. 2011 Oct;7(10):e1002290.
doi: 10.1371/journal.ppat.1002290. Epub 2011 Oct 13.

Endophytic life strategies decoded by genome and transcriptome analyses of the mutualistic root symbiont Piriformospora indica

Affiliations

Endophytic life strategies decoded by genome and transcriptome analyses of the mutualistic root symbiont Piriformospora indica

Alga Zuccaro et al. PLoS Pathog. 2011 Oct.

Abstract

Recent sequencing projects have provided deep insight into fungal lifestyle-associated genomic adaptations. Here we report on the 25 Mb genome of the mutualistic root symbiont Piriformospora indica (Sebacinales, Basidiomycota) and provide a global characterization of fungal transcriptional responses associated with the colonization of living and dead barley roots. Extensive comparative analysis of the P. indica genome with other Basidiomycota and Ascomycota fungi that have diverse lifestyle strategies identified features typically associated with both, biotrophism and saprotrophism. The tightly controlled expression of the lifestyle-associated gene sets during the onset of the symbiosis, revealed by microarray analysis, argues for a biphasic root colonization strategy of P. indica. This is supported by a cytological study that shows an early biotrophic growth followed by a cell death-associated phase. About 10% of the fungal genes induced during the biotrophic colonization encoded putative small secreted proteins (SSP), including several lectin-like proteins and members of a P. indica-specific gene family (DELD) with a conserved novel seven-amino acids motif at the C-terminus. Similar to effectors found in other filamentous organisms, the occurrence of the DELDs correlated with the presence of transposable elements in gene-poor repeat-rich regions of the genome. This is the first in depth genomic study describing a mutualistic symbiont with a biphasic lifestyle. Our findings provide a significant advance in understanding development of biotrophic plant symbionts and suggest a series of incremental shifts along the continuum from saprotrophy towards biotrophy in the evolution of mycorrhizal association from decomposer fungi.


Conflict of interest statement

The authors have declared that no competing interests exist.

Figures

Figure 1
Figure 1. P. indica colonizing autoclaved barley root cells at 5 dpi.
Fungal structures were stained with WGA-AF488 (green), plant cells were stained with propidium iodide (red). A) Cortex cells from autoclaved barley roots with fungal hyphae inside (5 dpi). B) Hyphal constriction at penetration site. C) Hyphae on and in the root tip. Images were taken with a Zeiss Axioplan fluorescence microscope with standard settings for WGA-AF488. The bars represent 10 µm.
Figure 2
Figure 2. Biotrophic growth of P. indica in barley root cortex cells.
Living root cortex cell with fungal hyphae inside (4 dpi). Fungal structures were stained with WGA-AF488 (green), plant membranes were stained with the endocytosis marker FM4-64 (red). A) FM4-64 and WGA-AF488, B) bright field, C) overlay. In contrast to extracellular hyphae, intracellular hyphae were not stainable with WGA-AF488, indicating that the hyphae remained enveloped in a plant-derived membrane throughout intracellular growth. Internalization of FM4-64 in the form of endomembrane structures after 20 min of incubation are visible inside the plant cell, indicating viability of the cells. Images were taken with a CLM, Leica TCS SP5 (Leica, Bensheim, Germany). The bar represents 10 µm.
Figure 3
Figure 3. Penetration of hyphae in living root cortex cells.
The upper panel shows vesicle transport at fungal penetration site. Fungal structures were stained with WGA-AF488 (green), plant membranes were stained with the endocytosis marker FM4-64 (red). The lower panel shows the presence of glycoproteins at the fungal penetration site. Fungal structures were stained with WGA-AF488 (green), α-mannopyranosyl and/or α-glucopyranosyl residues around the hyphal adhesion and penetration sites were stained with Concanavalin A (ConA-AF633, red) indicative of presence of glycoproteins. In barley leaves, papillae display a different composition from the adjacent cell wall and contain exosomes, H2O2, cell-wall cross linked proteins, thionins, callose, iron (Fe3+) and cell-wall cross linked phenolics but not cellulose and pectin , . Less information is available on the papillae composition in barley root. From left to right: WGA-AF488 channel; FM4-64/ConA-AF633 channel; bright field; overlay. Images were taken with a CLM, Leica TCS SP5 (Leica, Bensheim, Germany). The bars represent 10 µm.
Figure 4
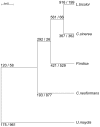
Figure 4. Neighbor joining (NJ) phylogenetic tree of 98 concatenated single copy genes (50,402 characters), constructed with PAUP .
Genes were selected from 245 eukaryotic core genes identified in Piriformospora indica, Laccaria bicolor, Coprinopsis cinerea, Cryptococcus neoformans and Ustilago maydis by blastp comparisons (eVal: 10-3) against the FUNYBASE . The bootstrap confidence level was 100 at each internal node. Numbers indicate the amount of gene families found to be expanded/contracted by CAFE analysis at the specific node as described in material and methods.
Figure 5
Figure 5. Different architecture of P. indica LysM and WSC containing proteins.
Protein domains in the genome of P. indica were identified using the PfamScan perl-script (ftp://ftp.sanger.ac.uk/pub/databases/Pfam/Tools/PfamScan.tar.gz; [38]). Results were validated with SMART . Domains were grouped based on their structure and visualized using DOG (version 1.0; [102]). Frequency of each domain is specified by the numbers below the brackets. A) Lectin-like LysM: 11 ORFs; LysM + polysaccharide deacetylase: 3 ORFs; LysM + peptidase M36 (fungalysin metallopeptidase): 2 ORFs; LysM + WSC: 1 ORF; LysM + glycoside hydrolase 88 (d-4,5 unsaturated β- glucuronyl hydrolase): 1 ORF; LysM + transmembrane domain (TM): 1 ORF. B) Lectin-like WSC: 28 ORFs; WSC + glyoxal oxidase: 3 ORFs; WSC + DUF 1996: 3 ORFs; WSC + LysM: 1 ORF; WSC + glycoside hydrolase 71 (α-1,3-glucanase): 1 ORF. C) Lectin-like CBM1: 14 ORFs; CBM1 + glycoside hydrolases: 32 ORFs; CBM1 + other catalytic enzymes: 15 ORFs.
Figure 6
Figure 6. P. indica-specific expansion of genes encoding LysM domain containing proteins.
Phylogram showing the relationships of concatenated LysM domains (left) and physical clusters of P. indica LysM domain containing proteins (right). MrBayes analyses were conducted with the fixed (Wag) aamodel and a sample frequency of 50 with 1,000,000 generations starting the tree randomly. Split frequency was 0.0058 and PSRF 1.00. Arabidopsis thaliana (Athal) and Vitis vinifera (Vitis) were used as out-group. Bootstrap values above 70% are shown at the nodes supported. Colors in the physical clusters represent LysM proteins with similar domain architecture. Lectin-like LysM (light blue); LysM + polysaccharide deacetylase (dark yellow); LysM + peptidase M36 (red); LysM + WSC (orange); LysM + glycoside hydrolase 88 (dark blue); neighboring proteins without a LysM domain are shown in black.
Figure 7
Figure 7. Relationship between individual P. indica LysM domains from 11 proteins.
MrBayes and PAUP phylogenetic analyses of individual LysM domains (left); and LysM domains architecture (right) of P. indica proteins. MrBayes analysis was conducted with the fixed (Wag) aamodel and a sample frequency of 50 with 500,000 generations starting the tree randomly. Split frequency was 0.06 and PSRF 1.001. Arabidopsis thaliana (AT) and Vitis vinifera (Vitis) were used as out-group. NJ tree was constructed using PAUP where ties (if encountered) were broken randomly, and the distance measure was the mean character difference. NJ cladogram was produced after a bootstrap analysis using maximum parsimony. MrBayes and NJ bootstrap values above 70% are shown at the nodes supported (right and left from the solidus respectively). Phylogenetically related LysM domains are shown in the same color in the tree (left) and in the schematic representation of the protein architectures (right). Signal peptides are shown in dark gray and non-LysM domains are shown in light gray. Numbers in the domains represent the number of amino acid residues of the domain as predicted by Pfamscan.
Figure 8
Figure 8. Venn diagrams showing P. indica genes regulated during root colonization.
(A) P. indica genes induced during symbiosis; (B) P. indica genes induced during growth on dead roots at different time points of the interaction. Diagrams were created using gnuplot (version 4.4 patchlevel 2; Williams and Kelley; www.gnuplot.info).
Figure 9
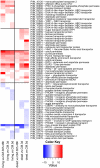
Figure 9. Differentially regulated P. indica hydrolytic enzymes.
Shown are expression data from 61 (38%) of the total 160 identified hydrolytic enzymes that are at least at one time point differentially regulated in the performed microarray experiments. Heatmaps were produced using R (www.R-project.org) and are based on significant expression fold changes calculated versus complete medium (CM) control. Gene sets were manually sorted into predominantly induced in living roots; predominantly induced in dead roots; induced in both, living and dead roots to similar extent; and down regulated compared to CM.
Figure 10
Figure 10. Plant responsive transporters in the genome of P. indica.
Shown are expression data from 64 (41%) of the 262 identified transporters that are at least at one time point differentially regulated. Identification of transporters was performed manually and a comparison against the transporter classification database (TCDB) (http://www.tcdb.org/) was done. Heatmaps were produced using R (www.R-project.org) and are based on significant expression fold changes calculated versus complete medium (CM). Gene sets were manually sorted into predominantly induced in living roots; predominantly induced in dead roots; induced in both, living and dead roots to similar extent; and down regulated compared to CM.
Figure 11
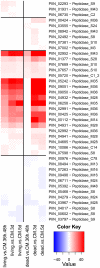
Figure 11. Differentially regulated P. indica peptidases.
Shown are expression data from 40 (28%) of the total 144 identified peptidases that are at least at one time point differentially regulated in the performed microarray experiments. Heatmaps were produced using R (www.R-project.org) and are based on significant expression fold changes calculated versus complete medium (CM). Gene sets were manually sorted into predominantly induced in living roots; predominantly induced in dead roots; induced in both, living and dead roots to similar extent; and down regulated compared to CM.
Figure 12
Figure 12. P. indica genes involved in stress response and secondary metabolism.
Shown is a selection of 44 manually identified genes. Heatmaps were produced using R (www.R-project.org) and are based on significant expression fold changes calculated versus complete medium (CM). Gene sets were manually sorted into predominantly induced in living roots; induced in both, living and dead roots to similar extent; and down regulated compared to CM.
Figure 13
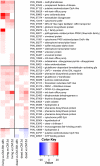
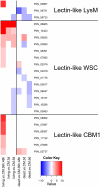
Figure 13. Differentially regulated P. indica lectin-like proteins.
Shown are expression data from 23 (19%) of the total 121 identified carbohydrate binding proteins. All 23 proteins are putatively secreted and are devoid of other conserved domains, resembling lectins. Heatmaps were produced using R (www.R-project.org) and are based on significant expression fold changes calculated versus complete medium (CM). Gene sets were manually sorted based on fold changes (high to low) in living plant material at the pre-penetration stage and separated into 3 groups of lectin-like proteins: LysM (predicted to bind to chitin); WSC (predicted to bind to glucan) and CBM1 (predicted to bind to cellulose).
Figure 14
Figure 14. Conserved residues positions and schematic representation of the P. indica DELD protein structure.
Regions with regularly distributed histidine (blue) and alanine (black) residues are visible in the consensus alignment (upper panel). The DELD proteins are predicted to produce two helices that are interrupted by a less conserved central region but with a conserved glycine (at position 65 in the consensus alignment). The sequence logo was created using WebLogo (version 2.8.2; [84]) based on a multiple sequence alignment of 29 DELD proteins without the predicted signal peptides using MUSCLE . Secondary protein structure prediction was performed using Phyre (Protein Homology/analogY Recognition Engine) (http://www.sbg.bio.ic.ac.uk/~phyre/ version 2.0; [113]) and is exemplary shown for PIIN_05872.
Figure 15
Figure 15. P. indica DELD proteins induced during colonization of barley roots (shown are 17 from the 29 identified DELD proteins).
Heatmaps were produced using R (www.R-project.org) and are based on significant expression fold changes calculated versus complete medium (CM). Gene sets were manually sorted into predominantly induced in living roots; and induced in both, living and dead roots to similar extent.

Similar articles

Cited by

References

    1. Weiss M, Sykorova Z, Garnica S, Riess K, Martos F, et al. Sebacinales everywhere: previously overlooked ubiquitous fungal endophytes. PLoS One. 2011;6:e16793. - PMC - PubMed
    1. Eaton CJ, Cox MP, Ambrose B, Becker M, Hesse U, et al. Disruption of signaling in a fungal-grass symbiosis leads to pathogenesis. Plant Physiol. 2010;153:1780–1794. - PMC - PubMed
    1. Rodriguez RJ, White JF, Jr, Arnold AE, Redman RS. Fungal endophytes: diversity and functional roles. New Phytol. 2009;182:314–330. - PubMed
    1. Koide RT, Sharda JN, Herr JR, Malcolm GM. Ectomycorrhizal fungi and the biotrophy-saprotrophy continuum. New Phytol. 2008;178:230–233. - PubMed
    1. Schulz B, Boyle C. The endophytic continuum. Mycol Res. 2005;109:661–686. - PubMed

Publication types

Substances