. 2011 Oct;7(10):e1002319.
doi: 10.1371/journal.ppat.1002319. Epub 2011 Oct 13.

Toll-8/Tollo negatively regulates antimicrobial response in the Drosophila respiratory epithelium

Affiliations

Toll-8/Tollo negatively regulates antimicrobial response in the Drosophila respiratory epithelium

Idir Akhouayri et al. PLoS Pathog. 2011 Oct.

Abstract

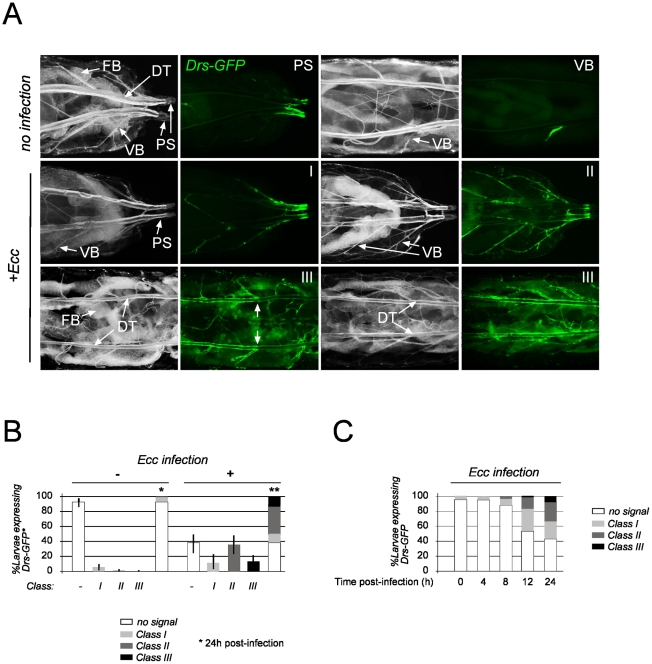
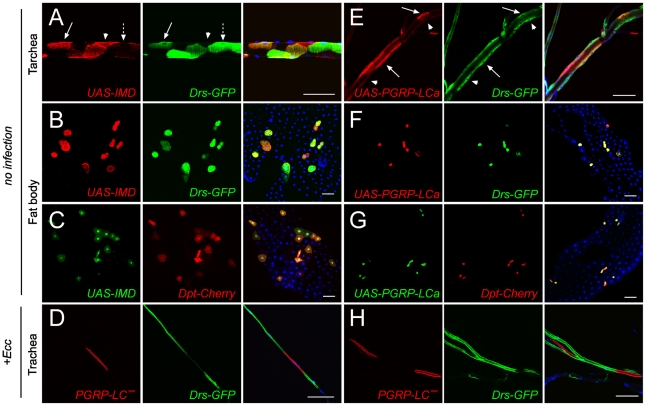
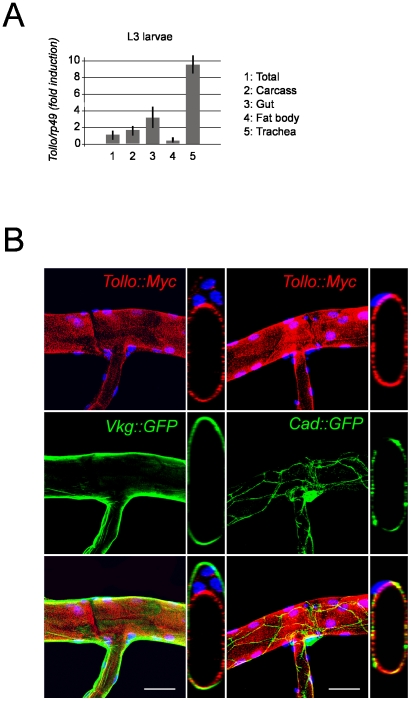
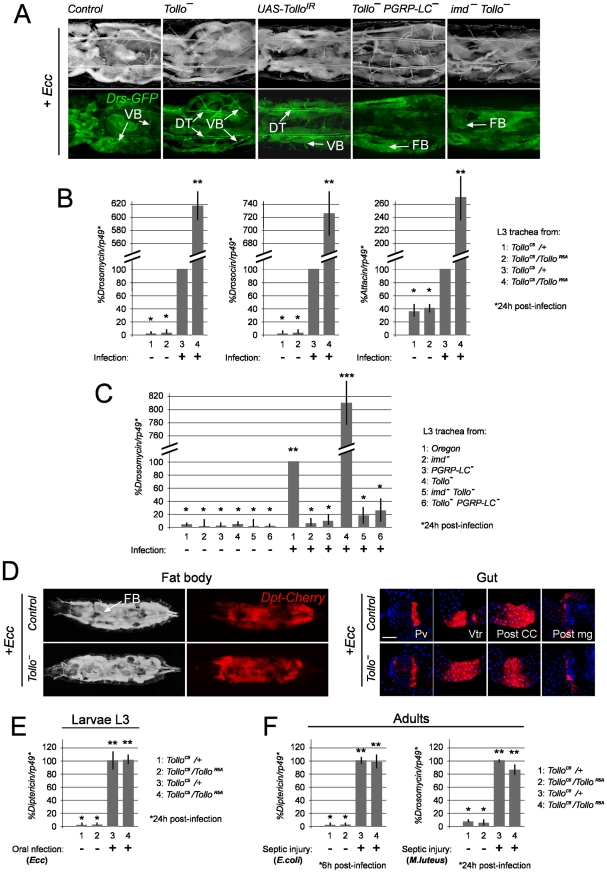
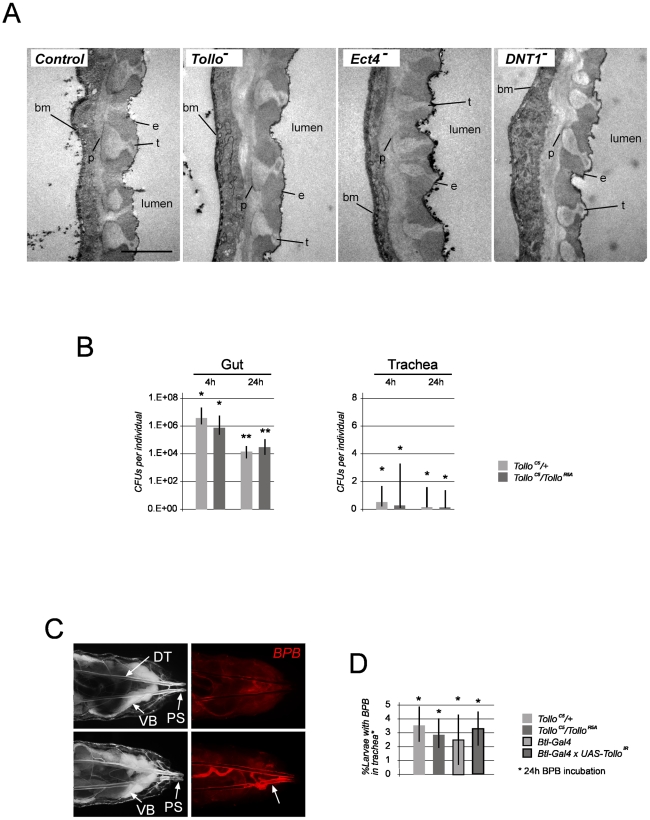
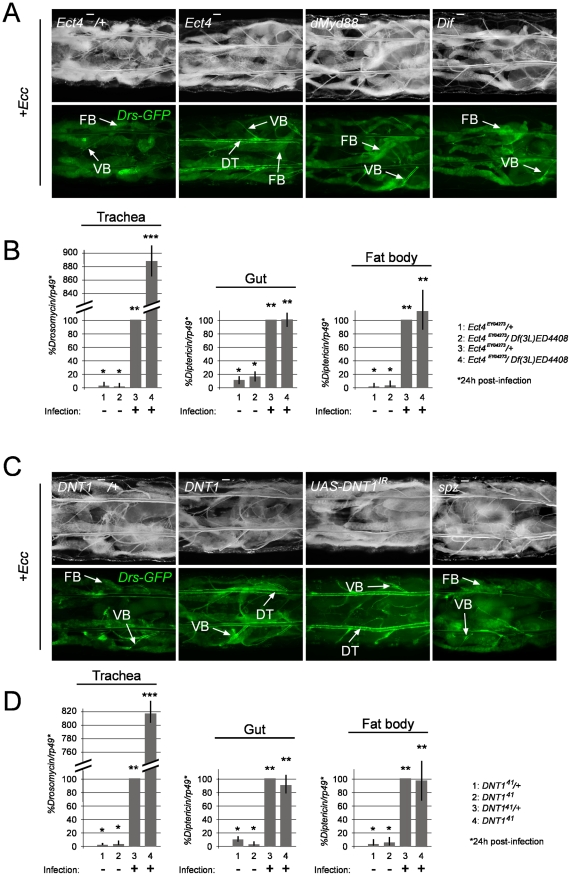
Barrier epithelia that are persistently exposed to microbes have evolved potent immune tools to eliminate such pathogens. If mechanisms that control Drosophila systemic responses are well-characterized, the epithelial immune responses remain poorly understood. Here, we performed a genetic dissection of the cascades activated during the immune response of the Drosophila airway epithelium i.e. trachea. We present evidence that bacteria induced-antimicrobial peptide (AMP) production in the trachea is controlled by two signalling cascades. AMP gene transcription is activated by the inducible IMD pathway that acts non-cell autonomously in trachea. This IMD-dependent AMP activation is antagonized by a constitutively active signalling module involving the receptor Toll-8/Tollo, the ligand Spätzle2/DNT1 and Ect-4, the Drosophila ortholog of the human Sterile alpha and HEAT/ARMadillo motif (SARM). Our data show that, in addition to Toll-1 whose function is essential during the systemic immune response, Drosophila relies on another Toll family member to control the immune response in the respiratory epithelium.


Conflict of interest statement

The authors have declared that no competing interests exist.

Figures

Figure 1
Figure 1. Spatio-temporal expression of tracheal Drosomycin-GFP.
(A) Dorsal view of Drs-GFP third instar larvae. In non-infected larvae, sporadic GFP expression is visible in posterior spiracles (PS) and/or in visceral branches (VB). Upon Ecc infection, larvae display a highly reproducible pattern of GFP expression, classified as follow: Class I, PS + posterior VB only; Class II, PS + all VB; Class III, VB + dorsal trunk (DT), with Drs-GFP first in the anterior half (limit marked by arrows) and only later, in the entire trunk. FB: fat body. (B) Quantification of tracheal Drs-GFP-positive larvae and distribution of classes upon Ecc infection. Each histogram corresponds to the mean value of 5 experiments. A total number of 100 larvae were counted for each experiment. Statistics apply for the “no signal” and the class III categories only. Values indicated by identical symbols (* or **) are not significantly different (P>0.05) from one another. All other differences are statistically significant (P<0.05). (C) Quantification of tracheal Drs-GFP-positive larvae at 4h, 8h, 12h and 24h post-infection by Ecc. Each histogram corresponds to the mean value of 3 experiments. A total number of 90 larvae were counted for each experiment.
Figure 2
Figure 2. IMD pathway activation is not strictly cell-autonomous in trachea.
IMD overexpressing clones in trachea (A) and fat body (B, C) cells are marked by RFP (A, B) or GFP (C) expression. (A) IMD overexpression activates Drs-GFP cell-autonomously (66%, n = 68) (arrow) and non-autonomously (12%, n = 68) (dashed arrow) in the trachea. Note that 34% (n = 68) of IMD-expressing cells are unable to activate Drs-GFP (arrow head). On the contrary, 98% (n = 38, for Drs-GFP) and 97% (n = 57, for Dpt-Cherry) of IMD-expressing cells activate Drs-GFP (B) Dpt-Cherry (C) in a strictly cell-autonomous fashion in the fat body. Clones overexpressing PGRP-LCa in trachea (E) and fat body (F, G) are marked by RFP (E, F) or GFP (G) expression. Tracheal cells expressing PGRP-LCa activate Drs-GFP autonomously (74%, n = 46) (arrow) and non-autonomously (39%, n = 46) (arrow head) (E). Fat body cells expressing PGRP-LCa (99%, n = 48 for Drs-GFP) and (98%, n = 63 for Dpt-Cherry) activate Drs-GFP (F) and Dpt-Cherry (G) autonomously. RFP expressing clones never activates Drs-GFP cell-autonomoulsy (0%, n = 52) nor cell non-autonomously (0%, n = 52) in the trachea. (D, H) Visceral branches of Ecc-infected larvae containing PGRP-LC mutant clones, marked by RFP expression (MARCM see Methods). Cells lacking PGRP-LC (red) are unable to activate Drs-GFP expression, while surrounding cells do (green). Nuclei are stained with Dapi (blue). Scale bar is 100 µm.
Figure 3
Figure 3. Apical localization of Tollo protein in tracheal cells.
(A) Tollo mRNA levels detected by q-RT-QPCR in third instar larval tissues. Histograms correspond to the mean +/- SD of 3 experiments. Tollo expression in total larva extract was set at 1. (B) Larval trachea expressing a Tollo::Myc fusion detected with an anti-Myc antibody (red) and expressing the basal membrane fusion protein Viking::GFP (green, left panels) or the apical marker Cadherin::GFP fusion (green, right panels). Z sectioning shown in smaller panels indicate that Tollo::Myc co-localizes with the Cadherin::GFP fusion and is excluded from the basement membrane. Both confocal stacks (large panels) and Z sectioning (small panel) are shown. Nuclei are stained with Dapi (blue). Scale bar is 50 µm.
Figure 4
Figure 4. Negative regulation of tracheal immune response by Tollo.
(A) Dorsal view of Ecc-infected larvae of the following genotypes: Control (Drs-GFP;;TolloC5/+), Tollo- (Drs-GFP;;TolloC5/TolloR5A), UAS-TolloIR (Drs-GFP;Btl-Gal4;UAS-TolloIR), Tollo-PGRP-LC- (Drs-GFP;;TolloC5,PGRP-LCDE12/TolloR5A,PGRP-LCDE12), imd-Tollo- (Drs-GFP; imd1/imd1;TolloC5/TolloR5A). The enhanced Drs-GFP expression observed in Tollo mutants is abolished when in conjunction with PGRP-LC or imd mutations. Images were taken 24h after Ecc infection. VB: visceral branch, DT: dorsal trunk, FB: fat body. (B) Infection-triggered AMP expression is enhanced in Tollo mutant trachea derived from third instar larvae (L3). The mRNA level post-infection in control flies (TolloC5/+) was set to 100, and values obtained with other genotypes were expressed as a percentage of this value. Each histogram corresponds to the mean value +/− SD of 3 experiments. Values indicated by identical symbols (* or **) are not significantly different (P>0.05) from one another. All other differences are statistically significant (P<0.05). (C) The enhanced Drosomycin mRNA induction in Tollo single mutants is lost when in conjunction with PGRP-LC or imd mutations. mRNA levels post-infection in control flies (OregonR) was set to 100, and values obtained with other genotypes were expressed as a percentage of this value. Each histogram corresponds to the mean value +/− SD of 3 experiments. Values indicated by identical symbols (*, ** or ***) are not significantly different (P>0.05) from one another. All other differences are statistically significant (P<0.05). (D) Dorsal view and confocal pictures of Ecc-infected larvae of the following genotypes: Control (TolloC5, Dpt-Cherry/+, Dpt-Cherry) and Tollo- (TolloC5,Dpt-Cherry/TolloR5A, Dpt-Cherry). Pv: pro-ventriculus, Vtr: posterior end of ventriculus, Post CC: posterior to copper cells, Post mg: posterior midgut. Scale bar for confocal pictures is 100 µm. (E, F) Systemic AMP expression after infection in larvae (E) or in adults (F). The mRNA level post-infection in control flies (TolloC5/+) was set to 100, and values obtained with other genotypes were expressed as a percentage of this value. Each histogram corresponds to the mean value +/− SD of 3 experiments. Values indicated by identical symbols (* or **) are not significantly different (P>0.05) from one another. All other differences are statistically significant (P<0.05).
Figure 5
Figure 5. Tracheal morphology, putative immune elicitors and fluid penetration in trachea are not affected by Tollo mutations.
(A) Electron microscopic pictures of tracheal transversal sections of control (Oregon R), Tollo mutant (TolloC5/TolloR5A), Ect4 mutant (Ect4EY04273/Df(3L)ED4408) or DNT1 mutant (DNT141/DNT141) third instar larvae. No obvious morphological differences could be observed between control and mutant trachea. (e) epicuticle, (t) taenidium, (p) procuticle and (bm) basement membrane. Scale bar is 2 µm. (B) Midgut and tracheal load of Ecc-GFP in control (TolloC5/+) and Tollo mutant (TolloC5/TolloR5A) third instar larvae, 4h and 24 h post-infection. Note that bacterial load for Ecc-GFP is much weaker in trachea when compare to midgut. Colony forming units (CFUs) per tissue are shown for each condition. n = 6 in triplicates. (C) Example of control larvae (Btl-Gal4) without (top panels) or with (bottom panels) red fluorescent BPB in trachea (arrow). Dorsal views of third instar larvae are shown. Pictures were taken 24 h after Bromophenol Blue (BPB) incubation. (D) Quantification of (BPB) entry in trachea of non-infected larvae. BPB entry is rare (around 5%) and not affected by Tollo mutations (TolloC5/TolloR5A), Tollo RNAi (Btl-Gal4;UAS-TolloIR) or infection (data not shown). Each histogram corresponds to the mean value +/− SD of 3 experiments. A total number of 90 larvae were counted for each experiment. Values indicated by identical symbols (*) are not significantly different (P>0.05) from one another.
Figure 6
Figure 6. The TIR domain-containing protein Ect4/SARM and the cytokine DNT1/Spz2 negatively regulate tracheal immune response.
(A) Dorsal view of Ecc-infected larvae of the following genotypes. Ect4-/+ (Drs-GFP;;Ect4EY04273/+), Ect4- (Drs-GFP;;Ect4EY04273/Df(3L)ED4408), dMyd88- (Drs-GFP; dMyd88c03881/dMyd88c03881) and Dif- (Drs-GFP;Dif1/Dif1). (B) Infection-triggered AMPs expression is enhanced in Ect4 mutant trachea, but not in gut or fat body. mRNA levels post-infection in control flies (Ect4EY04273/+) was set to 100, and values obtained with other genotypes were expressed as a percentage of this value. Each histogram corresponds to the mean value +/− SD of 3 experiments. Values indicated by identical symbols (* or **) are not significantly different (P>0.05) from one another. All other differences are statistically significant (P<0.05). (C) DNT1-/+, (Drs-GFP;;DNT141/+), DNT1-, (Drs-GFP;;DNT141/DNT141), UAS-DNT1IR (Drs-GFP; Btl-Gal4; UAS-DNT1IR) and spz- (Drs-GFP;; spzrm7/ spzrm7). VB: visceral branch, DT: dorsal trunk, FB: fat body. Pictures were taken 24h after infection. (D) Infection-triggered AMPs expression is enhanced in DNT1 mutant trachea, but not in gut or fat body. The mRNA level post-infection in control flies (DNT141/+) was set to 100, and values obtained with other genotypes were expressed as a percentage of this value. Each histogram corresponds to the mean value +/− SD of 3 experiments. Values indicated by identical symbols (* or **) are not significantly different (P>0.05) from one another. All other differences are statistically significant (P<0.05).

References

    1. Medzhitov R. Recognition of microorganisms and activation of the immune response. Nature. 2007;449:819–826. - PubMed
    1. Ferrandon D, Imler JL, Hetru C, Hoffmann JA. The Drosophila systemic immune response: sensing and signalling during bacterial and fungal infections. Nat Rev Immunol. 2007;7:862–874. - PubMed
    1. Lemaitre B, Hoffmann J. The host defense of Drosophila melanogaster. Annu Rev Immunol. 2007;25:697–743. - PubMed
    1. Akira S, Takeda K. Toll-like receptor signalling. Nat Rev Immunol. 2004;4:499–511. - PubMed
    1. Lemaitre B, Nicolas E, Michaut L, Reichhart JM, Hoffmann JA. The dorsoventral regulatory gene cassette spatzle/Toll/cactus controls the potent antifungal response in Drosophila adults. Cell. 1996;86:973–983. - PubMed

Publication types

MeSH terms