. 2011 Oct 18:5:123.
doi: 10.3389/fnins.2011.00123. eCollection 2011.

Binge Drinking: In Search of its Molecular Target via the GABA(A) Receptor

Affiliations

Binge Drinking: In Search of its Molecular Target via the GABA(A) Receptor

Andrew R S T Yang et al. Front Neurosci. .

Abstract

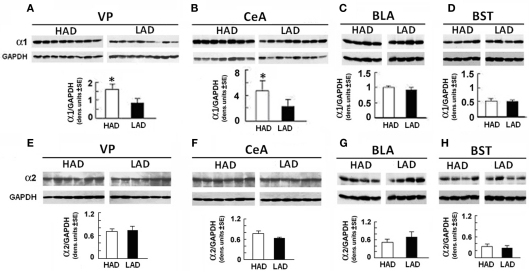
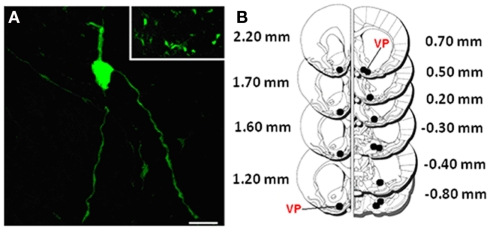
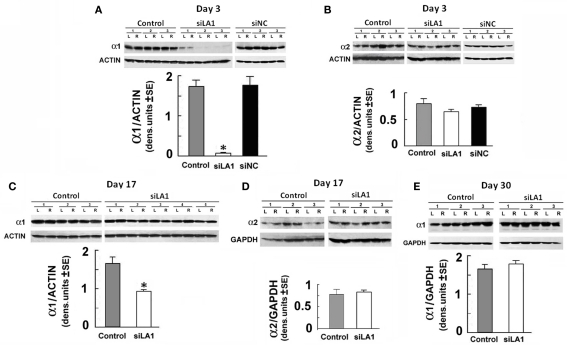
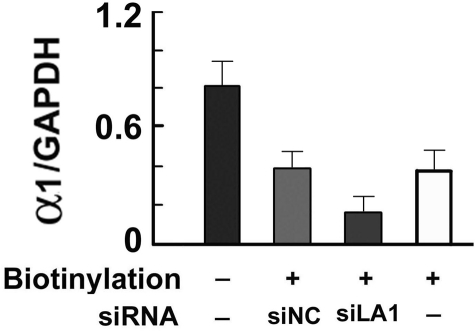
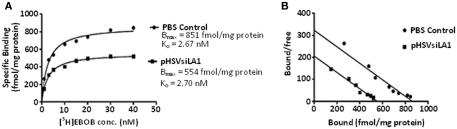
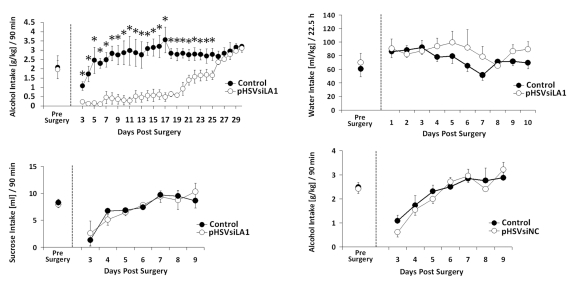
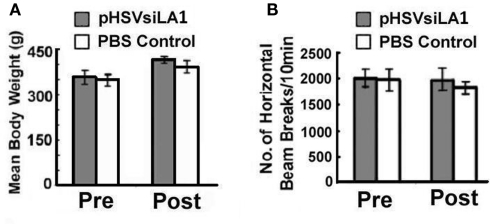
Binge drinking, frequently referred to clinically as problem or hazardous drinking, is a pattern of excessive alcohol intake characterized by blood alcohol levels ≥0.08 g% within a 2-h period. Here, we show that overexpression of α1 subunits of the GABA(A) receptor contributes to binge drinking, and further document that this involvement is related to the neuroanatomical localization of α1 receptor subunits. Using a herpes simplex virus amplicon vector to deliver small interference RNA (siRNA), we showed that siRNA specific for the α1 subunit (pHSVsiLA1) caused profound, long-term, and selective reduction of gene expression, receptor density, and binge drinking in high-alcohol drinking rats when delivered into the ventral pallidum (VP). Scrambled siRNA (pHSVsiNC) delivered similarly into the VP failed to alter gene expression, receptor density, or binge drinking. Silencing of the α1 gene in the VP, however, failed to alter binge sucrose or water intake. These results, along with our prior research, provide compelling evidence that the α1-containing GABA(A) receptor subunits are critical in the regulation of binge-like patterns of excessive drinking. Collectively, these data may be useful in the development of gene-based and novel pharmacological approaches for the treatment of excessive drinking.

Keywords: GABAA receptor; HAD rat; alcohol; alpha 1; binge drinking; siRNA; ventral pallidum; viral vector.


Figures

Figure 1
Figure 1
α1 expression is increased in the ventral pallidum (VP) and central amygdaloid nucleus (CeA) from HAD as compared with LAD rats. Micropunch samples were collected from the right and left hemispheres of rats and pooled. Protein extracts were immunoblotted with antibodies specific for the GABAA α1 (A–D) or α2 (E–H) subunits, using GAPDH antibody as control. Quantitation was done by densitometric scanning; each lane represents a distinct animal. The levels of α1 were significantly higher in the VP [F(1,14) = 15.15, P < 0.002] (A) and CeA [F(1,13) = 71.51, P < 0.001] (B) from HAD than LAD rats. The levels of α1 in the basolateral amygdaloid nucleus [BLA; (C)] and bed nucleus of the stria terminalis (BST) (D), as well as the levels of α2 at all these sites (E–H), were similar between HADs and LADs. The Newman–Keuls post hoc followed each significant between-group ANOVA. *P < 0.001.
Figure 2
Figure 2
Visualization represents low magnification of amplicon infected cells in the VP using confocal microscopy. (A) Low magnification showing a group of infected cells near 1 of the 13 bilateral VP (black) injection sites in (B); also depicted in high magnification is an individual neuron expressing the EGFP tag. Scale bar represents 25 μm in (A) and 250 μm in the insert. (B) Histological mapping of control and pHSVsiLA1 amplicon infusions across the VP, with coronal sections at +2.20 to −0.80 mm from bregma (Paxinos and Watson, 1998). Black dots indicate the bilateral stereotaxic infusion sites across the VP (red).
Figure 3
Figure 3
pHSVsiLA1 inhibits α1 expression in the VP. Micropunch samples of HAD rats given PBS (control), pHSVsiLA1, or pHSVsiNC (n = 3 each) into the VP by stereotaxic microinfusion were collected from the VP tissues on days 3 (A,B), 17 (C,D) or 30 (E) after infusion and assayed for gene expression by immunoblotting. Quantitation was done by densitometric scanning, and data are expressed as the mean ± SEM. Each well represents a sample of tissue from the left (L) or right (R) hemisphere of one animal; the levels of protein reduction were symmetrical in both the left (L) and right (R) hemispheres; hence, the data were pooled. (A) Immunoblotting with α1 antibody at 3 days post-infusion indicates that levels of α1 protein were significantly lower in rats given pHSVsiLA1 (siLA1) than PBS [F(2,15) = 173.43, P < 0.001], but similar α1 levels were seen in rats given PBS and pHSVsiNC (siNC). (B) Duplicates of the tissues used for (A) were immunoblotted with α2-specific antibody, with no significant group effects. (C,D) VP tissues from HAD rats given PBS (n = 3) or pHSVsiLA1 (n = 5, n = 3 respectively) as in (A,B) were immunoblotted with α1 or α2 antibodies at 17 days after infusion. α1 expression was still significantly lower in the pHSVsiLA1-treated rats [F(1,14) = 16.66, P < 0.001]. Immunoblotting with α2 antibody did not differentiate between the PBS and pHSVsiLA1-treated rats, and pHSVsiNC did not reduce α1 expression relative to PBS (data not shown). (E) Immunoblotting of VP tissues collected on day 30 after infusion indicated similar levels of α1 expression in PBS and pHSVsiLA1-treated rats. Significant effects were identified using the Tukey post hoc test; *P < 0.001.
Figure 4
Figure 4
Inhibition of biotin-labeled cell surface proteins. Eluates of WS-1 cells untreated (−) or transduced with pHSVsiLA1 or the scrambled control vector pHSVsiNC, examined for biotinylated GABA α1 protein by immunoblotting. Approximately 50% of the total levels of α1 protein expressed in the cells is biotinylated (i.e., expressed on the cell surface). Similar levels of biotinylated α1 protein were seen in cells treated with pHSVsiNC, but treatment with pHSVLA1 caused a significant decrease in the levels of biotinylated α1 protein [F(3,8) = 316.78, P < 0.001]. Subsequent Tukey post hoc test confirmed that inhibition of α1 expression by pHSVsiLA1 also caused a significant reduction in the levels of cell surface protein expression (P < 0.01).
Figure 5
Figure 5
Binding profile of [3H]EBOB in HAD rats microinfused with PBS (n = 10) or pHSVsiLA1 (n = 10) at 72 h post-infusion. (A) Saturation isotherm shows significant differences in specific binding between the two groups [F(3, 312) = 107, P < 0.0001]. A Tukey post hoc test detected that [3H]EBOB binding (B max) was reduced from 861 ± 16 to 554 ± 8 fmol/mg protein in control and pSHVsiLA1-treated rats, respectively, with no significant change in affinity (Kd; control, 2.67 ± 0.24 nM; pHSVsiLA1-treated, 2.70 ± 0.18 nM). (B) Scatchard analysis of [3H] EBOB binding to GABAA receptors in VP of PBS- (n = 10) or pHSVsiLA1- (n = 20) treated rats.
Figure 6
Figure 6
pHSVsiLA1 delivery into the VP inhibits alcohol intake in HAD rats. (A–C) HAD rats were microinfused with pHSVsiLA1 (n = 6) or PBS (control; n = 6) into the VP and examined for intake of alcohol (10% v/v) (A), water (B), or sucrose (C) in a home-cage bottle paradigm for 90 min. Alcohol results are expressed in grams per kilogram (g/kg). Prior to surgery, BACs in the PBS control and pHSVsiLA1 groups were 112 mg%/dL ± 13 and 118 mg%/dL ± 25, respectively. Two-way ANOVA revealed significant main effects of Day [F(28,140) = 5.58, P < 0.001], Group [F(1,5) = 86.184, P < 0.001], and a significant interaction for Day × Group [F(28,140) = 5.35, P < 0.001]. Relative to the control group, significant reductions in alcohol drinking were observed in the pHSVsiLA1-treated group from days 3–25 (Tukey post hoc test). Alcohol intake was similar during days 26–30 for the pHSVsiLA1 and PBS control groups. (B) Water intake (mL/kg)/22.5 h was also similar across pre-surgical days and post-surgical days 1–10 between the pHSVsiLA1 and PBS control groups. (C) Sucrose intake in the two-bottle choice home-cage paradigm over the 90-min period. ANOVA revealed a significant session effect [F(7,74) = 3.616, P < 0.0001]. Specifically, both the control and pHSVsiLA1 pre-surgery groups demonstrated significantly higher drinking than the post-surgery groups on day 3 (P < 0.01). However, no differences were observed between the two groups at pre-surgery or at any post-surgery time point (P > 0.01). (D) HAD rats were given the scrambled amplicon pHSVsiNC (n = 6) or PBS (control; n = 6) into the VP and examined for alcohol consumption. Results are expressed in grams per kilogram (g/kg) during the daily 90 min alcohol sessions. Prior to surgery, BACs in the PBS and pHSVsiNC groups were 133 mg%/dL ± 26 and 122 mg%/dL ± 21, respectively. ANOVA revealed a significant session effect [F(7, 80) = 11.96, P < 0.0001], but no group effects. Specifically, drinking in the both the control and pHSVsiNC pre-surgery groups was significantly greater than in the post-surgery groups on days 3 and 4 (P < 0.01). However, no differences were observed between the two groups at pre-surgery or at any post-surgery time point (P > 0.01). Significant effects were identified using the Newman–Keuls post hoc test.
Figure 7
Figure 7
Amplicon vectors do not alter body weight or locomotor activity measurements in the open-field in HAD rats. (A) Body weights and locomotor measures for animals given pHSVsiLA1 or PBS control (n = 8 each/total = 16) at 96 h post-surgery (4 days). No significant differences were observed between groups for body weight [F(3, 28) = 0.252, P > 0.05]. (B) In addition, locomotor activity (i.e., horizontal activity over a 10-min period) was also similar for animals given PBS and pHSVsiLA1 (n = 8 each/total = 16) at 96 h post-surgery (4 days) [F(3, 28) = 0.0278, P > 0.994]. No significant differences between groups were observed.

References

    1. Bell R. L., Rodd Z. A., Lumeng L., Murphy J. M., McBride W. J. (2006). The alcohol-preferring p rat and animal models of excessive alcohol drinking. Addict. Biol. 11, 270–28810.1111/j.1369-1600.2005.00029.x - DOI - PubMed
    1. Boehm S. L., II, Ponomarev I., Jennings A. W., Whiting P. J., Rosahl T. W., Garrett E. M., Blednov Y. A., Harris R. A. (2004). Gamma-aminobutyric acid A receptor subunit mutant mice: new perspectives on alcohol actions. Biochem. Pharmacol. 68, 1581–1602 [Review].10.1016/j.bcp.2004.07.023 - DOI - PubMed
    1. Buckholtz J. W., Treadway M. T., Cowan R. L., Woodward N. D., Li R., Ansari M. S., Baldwin R. M., Schwartzman A. N., Shelby E. S., Smith C. E., Kessler R. M., Zald D. H. (2010). Dopaminergic network differences in human impulsivity. Science 29, 532.10.1126/science.1185778 - DOI - PMC - PubMed
    1. Center for Disease Control and Prevention (CDCP) (2004). Alcohol-attributable deaths and years of potential life lost – United States 2001. MMWR Morb. Mortal. Wkly. Rep. 53, 866–870 - PubMed
    1. Chikritzhs T. N., Jonas H. A., Stockwell T. R., Heale P. F., Dietze P. M. (2001). Mortality and life-years lost due to alcohol: a comparison of acute and chronic causes. Med. J. Aust. 174, 281–284 - PubMed

LinkOut - more resources