

An MRI-derived definition of MCI-to-AD conversion for long-term, automatic prognosis of MCI patients
- PMID: 22022375
- PMCID: PMC3192038
- DOI: 10.1371/journal.pone.0025074
An MRI-derived definition of MCI-to-AD conversion for long-term, automatic prognosis of MCI patients
Abstract
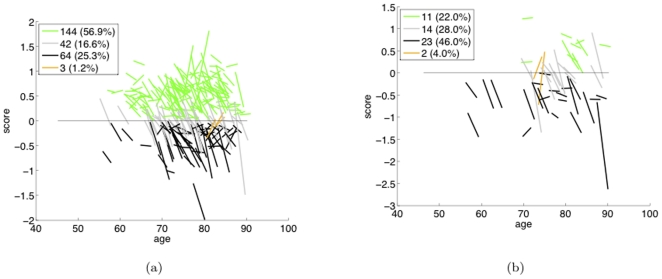
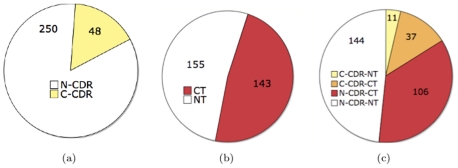
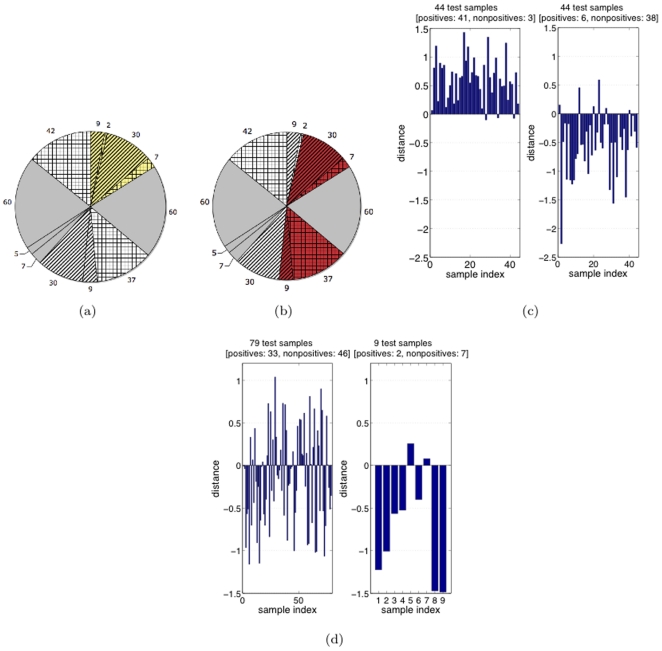
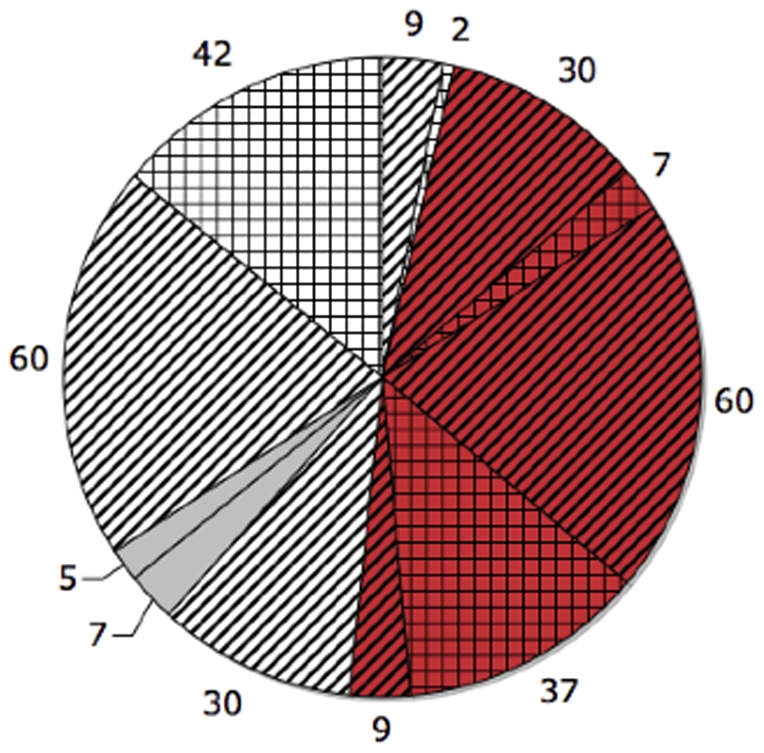
Alzheimer's disease (AD) and mild cognitive impairment (MCI) are of great current research interest. While there is no consensus on whether MCIs actually "convert" to AD, this concept is widely applied. Thus, the more important question is not whether MCIs convert, but what is the best such definition. We focus on automatic prognostication, nominally using only a baseline brain image, of whether an MCI will convert within a multi-year period following the initial clinical visit. This is not a traditional supervised learning problem since, in ADNI, there are no definitive labeled conversion examples. It is not unsupervised, either, since there are (labeled) ADs and Controls, as well as cognitive scores for MCIs. Prior works have defined MCI subclasses based on whether or not clinical scores significantly change from baseline. There are concerns with these definitions, however, since, e.g., most MCIs (and ADs) do not change from a baseline CDR = 0.5 at any subsequent visit in ADNI, even while physiological changes may be occurring. These works ignore rich phenotypical information in an MCI patient's brain scan and labeled AD and Control examples, in defining conversion. We propose an innovative definition, wherein an MCI is a converter if any of the patient's brain scans are classified "AD" by a Control-AD classifier. This definition bootstraps design of a second classifier, specifically trained to predict whether or not MCIs will convert. We thus predict whether an AD-Control classifier will predict that a patient has AD. Our results demonstrate that this definition leads not only to much higher prognostic accuracy than by-CDR conversion, but also to subpopulations more consistent with known AD biomarkers (including CSF markers). We also identify key prognostic brain region biomarkers.
Conflict of interest statement
Figures
References
-
- Petersen RC. Mild cognitive impairment: aging to Alzheimer's Disease. Oxford University Press; 2004.
-
- Chou Y-Y, Leporé N, Avedissian C, Madsen SK, Hua X, et al. Mapping Ventricular Expansion and its Clinical Correlates in Alzheimer's Disease and Mild Cognitive Impairment using Multi-Atlas Fluid Image Alignment. 2009. Proc. SPIE 7259.
-
- Davatzikos C, Bhatt P, Shaw LM, Batmanghelich KN, Trojanowski JQ. Prediction of MCI to AD conversion, via MRI, CSF biomarkers, and pattern classification. Neurobiology of Aging. 2010 doi: 10.1016/j.neurobiolaging.2010.05.023. - DOI - PMC - PubMed
Publication types
MeSH terms
Substances
Grants and funding
LinkOut - more resources
Full Text Sources
Medical
