

An efficient coding hypothesis links sparsity and selectivity of neural responses
- PMID: 22022405
- PMCID: PMC3192758
- DOI: 10.1371/journal.pone.0025506
An efficient coding hypothesis links sparsity and selectivity of neural responses
Abstract
To what extent are sensory responses in the brain compatible with first-order principles? The efficient coding hypothesis projects that neurons use as few spikes as possible to faithfully represent natural stimuli. However, many sparsely firing neurons in higher brain areas seem to violate this hypothesis in that they respond more to familiar stimuli than to nonfamiliar stimuli. We reconcile this discrepancy by showing that efficient sensory responses give rise to stimulus selectivity that depends on the stimulus-independent firing threshold and the balance between excitatory and inhibitory inputs. We construct a cost function that enforces minimal firing rates in model neurons by linearly punishing suprathreshold synaptic currents. By contrast, subthreshold currents are punished quadratically, which allows us to optimally reconstruct sensory inputs from elicited responses. We train synaptic currents on many renditions of a particular bird's own song (BOS) and few renditions of conspecific birds' songs (CONs). During training, model neurons develop a response selectivity with complex dependence on the firing threshold. At low thresholds, they fire densely and prefer CON and the reverse BOS (REV) over BOS. However, at high thresholds or when hyperpolarized, they fire sparsely and prefer BOS over REV and over CON. Based on this selectivity reversal, our model suggests that preference for a highly familiar stimulus corresponds to a high-threshold or strong-inhibition regime of an efficient coding strategy. Our findings apply to songbird mirror neurons, and in general, they suggest that the brain may be endowed with simple mechanisms to rapidly change selectivity of neural responses to focus sensory processing on either familiar or nonfamiliar stimuli. In summary, we find support for the efficient coding hypothesis and provide new insights into the interplay between the sparsity and selectivity of neural responses.
Conflict of interest statement
Figures
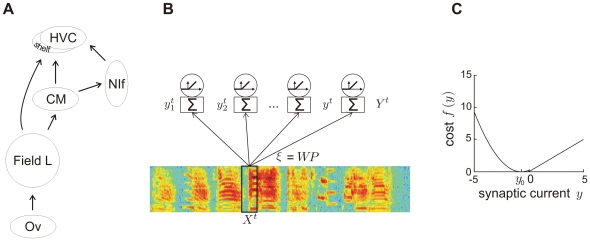
 , the auditory input to the network is a 50-ms window
  of the sound spectrogram. This input is multiplied by synaptic weights
  to result in total synaptic currents
  onto
onto  neurons.
  stands for whitening and dimensionality reduction (principal component analysis), and
  stands for a sparseness transformation. Neural firing rates are given by rectified synaptic currents. (C) Cost function for a threshold
  . Subthreshold synaptic currents
  are punished quadratically and suprathreshold currents are punished linearly. The parameter
  defining the subthreshold current eliciting minimal cost is set to the expected subthreshold current
  . Synaptic currents are reported in units of mean-subtracted standard deviations (z-scores). A threshold
  implies that suprathreshold currents are depolarizing (positive), whereas subthreshold currents are hyperpolarizing (negative).
  .
.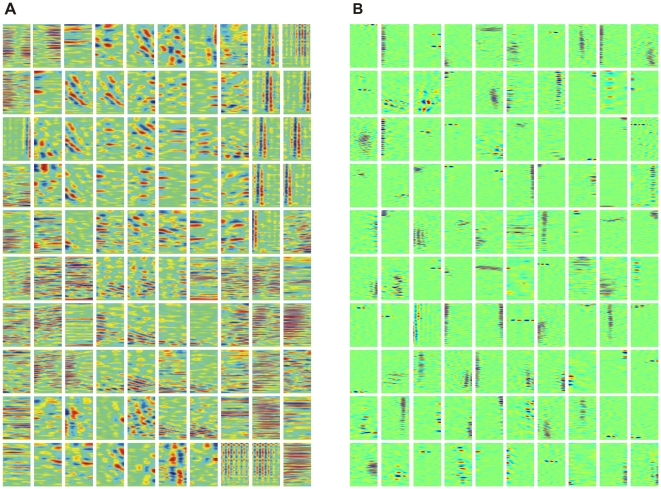
 neurons, arranged by nearest-neighbor similarity (circular boundary conditions). Neurons tend to be either temporally tuned (vertical stripes, top right), spectrally tuned (horizontal stripes, middle rows), or display more complex spectro-temporal patterns. Spectral resolution is 172 Hz, offset between subsequent cochlear inputs is 1.5 ms. (B) STRFs obtained with a linear cost on synaptic weight magnitudes. The linear cost forces many synaptic weights to be close to zero (green), leading to low-density STRFs most of which contain a smaller number of excitatory and inhibitory subfields than in A. Interestingly, excitatory and inhibitory subfields tend to be close to each other and aligned horizontally or vertically, similar to observations in field L neurons. The 100 presented STRFs were randomly chosen out of the total 800.
  .
.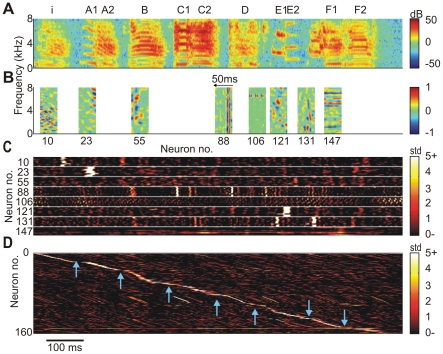
 of eight representative neurons (
 ). The horizontal alignment of STRFs with the spectrogram in A is such that the trailing edges of the STRFs correspond to the respective peak times of synaptic currents. The temporal axis of the STRFs is inverted for better comparison with the BOS spectrogram. (C) Stack plot of synaptic currents of representative neurons in B in response to ten different versions of BOS, vertically aligned to A. (D) Neurogram of synaptic currents in response to the BOS in A. The
  neurons are sorted according to the peak times of their synaptic currents. Fewer neurons display synaptic current peaks during syllable gaps (blue arrows) than during syllables.
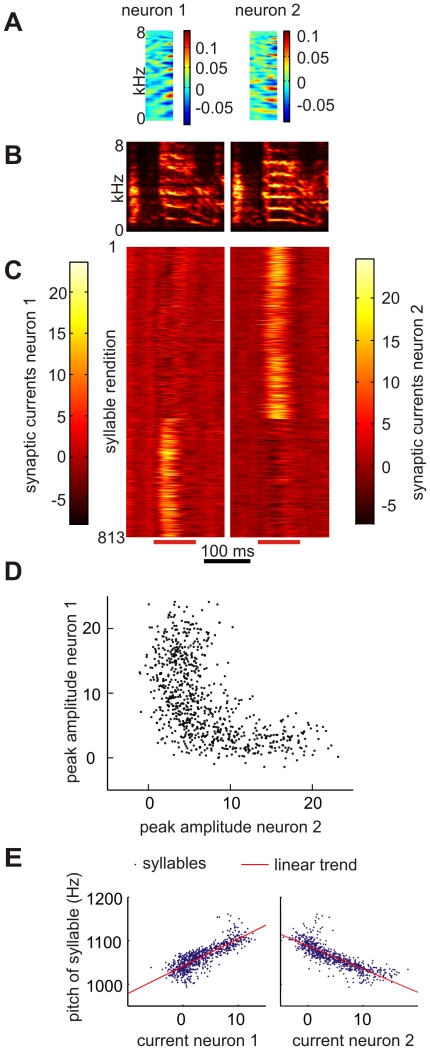
 ,
,  , Neuron 2:
  ,
,  ),
),  ,
,  .
.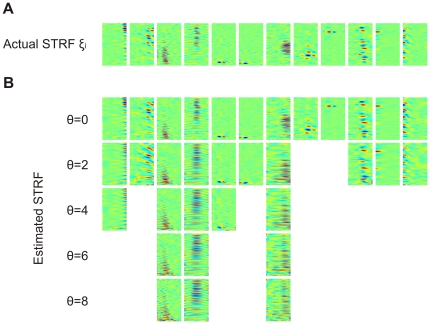
 obtained after convergence of the algorithm (
 ). (B) Estimated STRFs (reverse correlation) based on the predicted firing rates
  . Shown are only estimated STRFs for neurons associated with a correlation coefficient
  between predicted and actual firing rates of
  .
.  .
.  .
.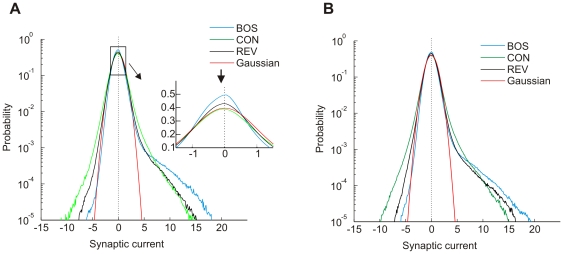
 averaged over all neurons has a heavy tail on the positive side. Shown are the densities for BOS (blue), CON (green), and REV (black). Near zero synaptic currents, the curves are approximatively unit Gaussian (red), though their excessive peaks are slightly shifted to the negative side (inset, arrow). The curves cross each other such that large positive synaptic currents are preferentially elicited by the BOS and small positive currents by REV and CON.
  ,
,  . (B) The distributions of synaptic currents for sparse STRFs (Figure 2B) are qualitatively similar to (A). The only noticeable difference is that the distribution for REV is closer to BOS, reflecting a lower selectivity for temporal order.
  .
.
 to
to  . Noise amplitude
  .
.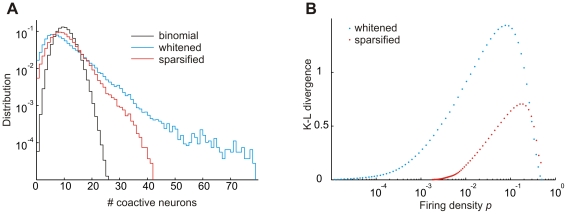
 of the binomial distribution (that a neuron is active per unit time) was estimated in terms of the firing density (the fraction of suprathreshold events over all neurons and training stimuli). Probabilities
  were nearly identical for whitening and whitening+sparseness when
  (
( and
and  during learning). (B) The Kullback–Leibler divergence between size distributions is smaller when comparing the whitening+sparseness model to the binomial model than when comparing the whitening model to the binomial model, for nearly all firing densities tested.
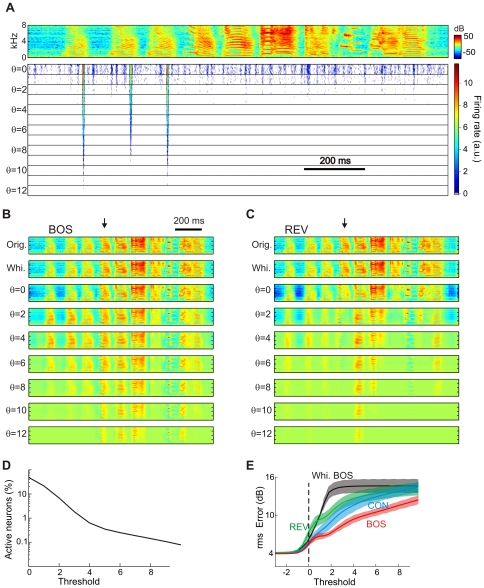
 to
to  ). The BOS spectrogram is shown on top. This neuron is tuned to a feature present in introductory notes and responds to it up to thresholds higher than seven. For each threshold, ten different responses are plotted, corresponding to ten different instantiations of synaptic noise.
  . (B) The reconstruction of a BOS spectrogram (orig., top) using all neurons, based on a firing threshold of minus infinity (whi., 2nd from top) is fairly complete with little information loss (arising from dimensionality reduction). With increasing thresholds (below), more and more syllables are lost in the reconstruction, but the reconstructed spectro-temporal patterns remain clearly recognizable. The arrow points to a down-sweep syllable. (C) Reconstructions of REV (flipped horizontally for comparison with B) are worse than reconstructions of BOS at the same threshold; for example the down-sweep syllable is not well reconstructed (arrow), presumably because zebra finches produce almost no up-sweeps. (D) The fraction of active neurons (averaged over all BOS stimuli) decreases with increasing threshold such that at
  about 1% of neurons are active on average. This fraction decreases to 0.1% at about
  . (E) The reconstruction errors averaged over different stimulus ensembles are monotonic functions of the firing threshold. For a given positive threshold, reconstruction errors increase from BOS to CON to REV.
  threshold-linear neurons.
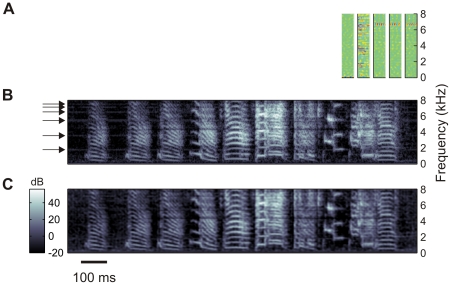
 , with exception of the five neurons in A in which the thresholds were set to
  . The monitor noise has vanished in the reconstructions, without affecting the birdsong signal.
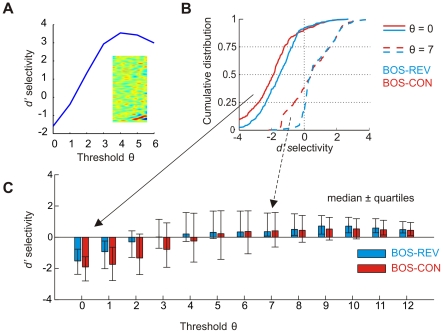
 selectivity is negative for low thresholds
  and turns positive for thresholds
  . (B) Example cumulative distributions of BOS-REV (blue) and BOS-CON (red)
  selectivities across
  neurons for
  (solid lines) and
  (dashed lines). For
  the selectivities are biased towards negative values, whereas for
  the distributions are biased towards positive values. (C) Bar plot summarizing BOS-REV (blue) and BOS-CON (red) selectivities for a wide range of firing thresholds. The colored bars indicate the median
  selectivity and the error bars delimit the first and third quartiles. Selectivity reverses at around
  (REV) and
  (CON).
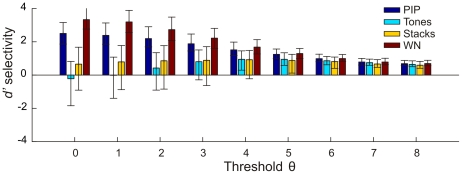
 quartiles. PIP = tone-pip stimuli, WN = white noise.
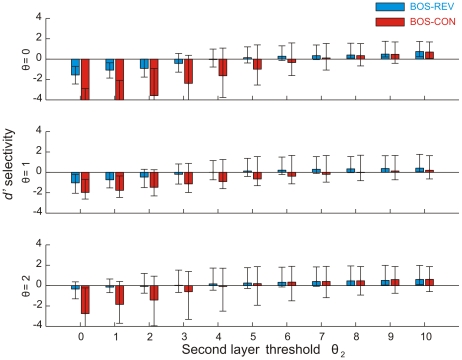
 in the first layer and
  in the second layer. In each simulation, second-layer responses were evaluated using the first-layer threshold applied during training. As can be seen, BOS preference in the second layer is restricted to the high-sparseness regime there (right part of the three subplots).
Similar articles
-
Principles of auditory processing differ between sensory and premotor structures of the songbird forebrain.J Neurophysiol. 2017 Mar 1;117(3):1266-1280. doi: 10.1152/jn.00462.2016. Epub 2016 Dec 28. J Neurophysiol. 2017. PMID: 28031398 Free PMC article.
-
Synaptic interactions underlying song-selectivity in the avian nucleus HVC revealed by dual intracellular recordings.J Neurophysiol. 2006 Feb;95(2):1158-75. doi: 10.1152/jn.00100.2005. J Neurophysiol. 2006. PMID: 16424457
-
The selectivity of canary HVC neurons for the Bird's Own Song: rate coding, temporal coding, or both?J Physiol Paris. 2004 Jul-Nov;98(4-6):395-406. doi: 10.1016/j.jphysparis.2005.09.011. Epub 2005 Nov 4. J Physiol Paris. 2004. PMID: 16275046
-
Song- and order-selective neurons develop in the songbird anterior forebrain during vocal learning.J Neurobiol. 1997 Nov;33(5):694-709. J Neurobiol. 1997. PMID: 9369467 Review.
-
Cellular, circuit, and synaptic mechanisms in song learning.Ann N Y Acad Sci. 2004 Jun;1016:495-523. doi: 10.1196/annals.1298.035. Ann N Y Acad Sci. 2004. PMID: 15313792 Review.
Cited by
-
Activity in a premotor cortical nucleus of zebra finches is locally organized and exhibits auditory selectivity in neurons but not in glia.PLoS One. 2013 Dec 3;8(12):e81177. doi: 10.1371/journal.pone.0081177. eCollection 2013. PLoS One. 2013. PMID: 24312533 Free PMC article.
-
Selective and efficient neural coding of communication signals depends on early acoustic and social environment.PLoS One. 2013 Apr 22;8(4):e61417. doi: 10.1371/journal.pone.0061417. Print 2013. PLoS One. 2013. PMID: 23630587 Free PMC article.
-
Sensory cortex is optimized for prediction of future input.Elife. 2018 Jun 18;7:e31557. doi: 10.7554/eLife.31557. Elife. 2018. PMID: 29911971 Free PMC article.
-
Neural representation of a target auditory memory in a cortico-basal ganglia pathway.J Neurosci. 2013 Sep 4;33(36):14475-88. doi: 10.1523/JNEUROSCI.0710-13.2013. J Neurosci. 2013. PMID: 24005299 Free PMC article.
-
Neural heterogeneity promotes robust learning.Nat Commun. 2021 Oct 4;12(1):5791. doi: 10.1038/s41467-021-26022-3. Nat Commun. 2021. PMID: 34608134 Free PMC article.
References
-
- Hochstein S, Ahissar M. View from the top - hierarchies and reverse hierarchies in the visual system. Neuron. 2002;36:791–804(14). - PubMed
-
- Quiroga RQ, Reddy L, Kreiman G, Koch C, Fried I. Invariant visual representation by single neurons in the human brain. Nature. 2005;435:1102–1107. - PubMed
-
- Olshausen BA, Field DJ. Sparse coding of sensory input. Curr Opin Neurobiol. 2004;14:481–487. - PubMed
Publication types
MeSH terms
LinkOut - more resources
Full Text Sources
