

Muscle-bound primordial stem cells give rise to myofiber-associated myogenic and non-myogenic progenitors
- PMID: 22022423
- PMCID: PMC3194814
- DOI: 10.1371/journal.pone.0025605
Muscle-bound primordial stem cells give rise to myofiber-associated myogenic and non-myogenic progenitors
Abstract
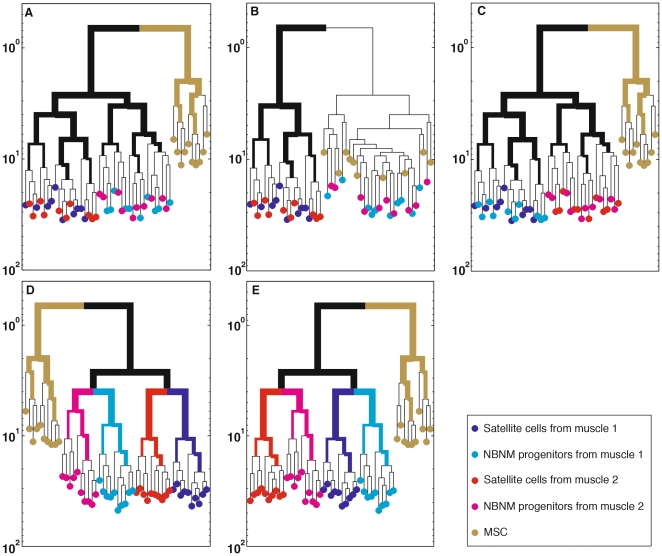
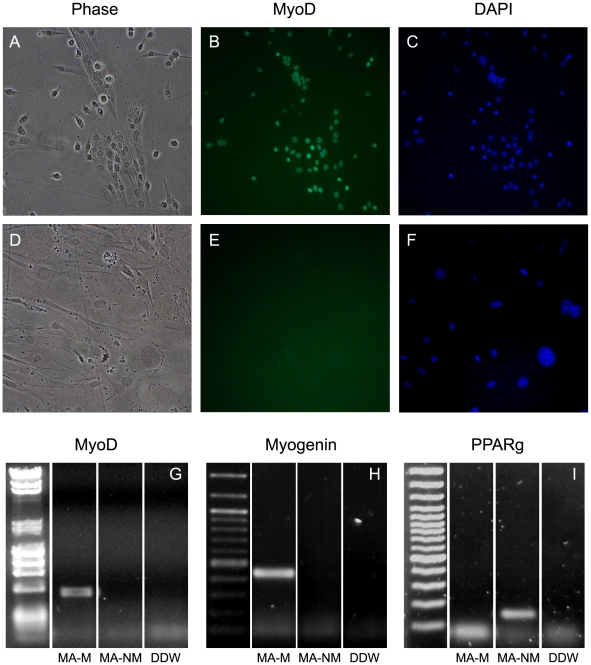
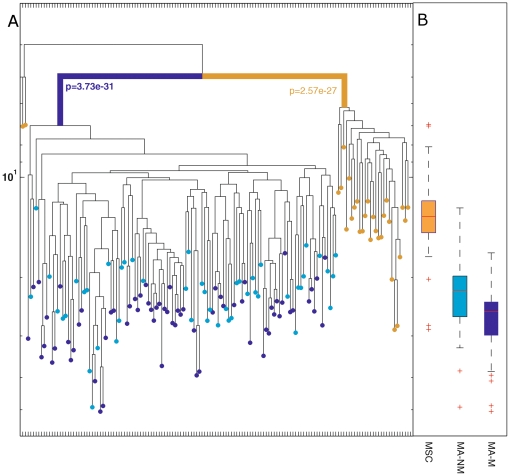
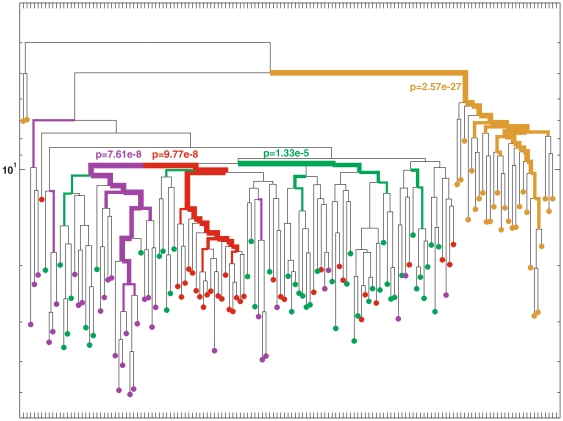
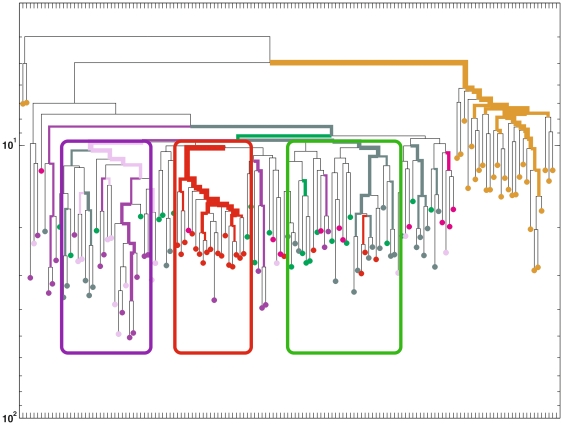
Myofiber cultures give rise to myogenic as well as to non-myogenic cells. Whether these myofiber-associated non-myogenic cells develop from resident stem cells that possess mesenchymal plasticity or from other stem cells such as mesenchymal stem cells (MSCs) remain unsolved. To address this question, we applied a method for reconstructing cell lineage trees from somatic mutations to MSCs and myogenic and non-myogenic cells from individual myofibers that were cultured at clonal density.Our analyses show that (i) in addition to myogenic progenitors, myofibers also harbor non-myogenic progenitors of a distinct, yet close, lineage; (ii) myofiber-associated non-myogenic and myogenic cells share the same muscle-bound primordial stem cells of a lineage distinct from bone marrow MSCs; (iii) these muscle-bound primordial stem-cells first part to individual muscles and then differentiate into myogenic and non-myogenic stem cells.
Conflict of interest statement
Figures
Similar articles
-
Induction of bone marrow-derived cells myogenic identity by their interactions with the satellite cell niche.Stem Cell Res Ther. 2018 Sep 27;9(1):258. doi: 10.1186/s13287-018-0993-z. Stem Cell Res Ther. 2018. PMID: 30261919 Free PMC article.
-
Myogenic potential of mesenchymal stem cells isolated from porcine adipose tissue.Cell Tissue Res. 2018 Jun;372(3):507-522. doi: 10.1007/s00441-017-2764-z. Epub 2018 Jan 9. Cell Tissue Res. 2018. PMID: 29318389
-
Reprogramming of human umbilical cord stromal mesenchymal stem cells for myogenic differentiation and muscle repair.Stem Cell Rev Rep. 2010 Dec;6(4):512-22. doi: 10.1007/s12015-010-9177-7. Stem Cell Rev Rep. 2010. PMID: 20665127
-
Reflections on lineage potential of skeletal muscle satellite cells: do they sometimes go MAD?Crit Rev Eukaryot Gene Expr. 2007;17(1):13-29. doi: 10.1615/critreveukargeneexpr.v17.i1.20. Crit Rev Eukaryot Gene Expr. 2007. PMID: 17341181 Free PMC article. Review.
-
Impact of tissue-specific stem cells on lineage-specific differentiation: a focus on the musculoskeletal system.Stem Cell Rev Rep. 2015 Feb;11(1):119-32. doi: 10.1007/s12015-014-9546-8. Stem Cell Rev Rep. 2015. PMID: 25113801 Free PMC article. Review.
Cited by
-
Role of stem/progenitor cells in reparative disorders.Fibrogenesis Tissue Repair. 2012 Dec 27;5(1):20. doi: 10.1186/1755-1536-5-20. Fibrogenesis Tissue Repair. 2012. PMID: 23270300 Free PMC article.
-
Single-cell sequencing-based technologies will revolutionize whole-organism science.Nat Rev Genet. 2013 Sep;14(9):618-30. doi: 10.1038/nrg3542. Epub 2013 Jul 30. Nat Rev Genet. 2013. PMID: 23897237 Review.
-
Comparing algorithms that reconstruct cell lineage trees utilizing information on microsatellite mutations.PLoS Comput Biol. 2013;9(11):e1003297. doi: 10.1371/journal.pcbi.1003297. Epub 2013 Nov 14. PLoS Comput Biol. 2013. PMID: 24244121 Free PMC article.
-
Adipogenic Differentiation of Muscle Derived Cells is Repressed by Inhibition of GSK-3 Activity.Front Vet Sci. 2018 Jun 12;5:110. doi: 10.3389/fvets.2018.00110. eCollection 2018. Front Vet Sci. 2018. PMID: 29946551 Free PMC article.
-
Accuracy of Answers to Cell Lineage Questions Depends on Single-Cell Genomics Data Quality and Quantity.PLoS Comput Biol. 2016 Jun 13;12(6):e1004983. doi: 10.1371/journal.pcbi.1004983. eCollection 2016 Jun. PLoS Comput Biol. 2016. PMID: 27295404 Free PMC article.
References
-
- Brand-Saberi B, Christ B. Evolution and development of distinct cell lineages derived from somites. Curr Top Dev Biol. 2000;48:1–42. - PubMed
-
- Huang R, Christ B. Origin of the epaxial and hypaxial myotome in avian embryos. Anat Embryol (Berl) 2000;202:369–374. - PubMed
-
- Brent AE, Tabin CJ. Developmental regulation of somite derivatives: muscle, cartilage and tendon. Curr Opin Genet Dev. 2002;12:548–557. - PubMed
-
- Stockdale FE, Nikovits W, Jr, Christ B. Molecular and cellular biology of avian somite development. Dev Dyn. 2000;219:304–321. - PubMed
-
- Gros J, Manceau M, Thome V, Marcelle C. A common somitic origin for embryonic muscle progenitors and satellite cells. Nature. 2005;435:954–958. - PubMed
Publication types
MeSH terms
Substances
LinkOut - more resources
Full Text Sources
Medical
