

Testing protein leverage in lean humans: a randomised controlled experimental study
- PMID: 22022472
- PMCID: PMC3192127
- DOI: 10.1371/journal.pone.0025929
Testing protein leverage in lean humans: a randomised controlled experimental study
Abstract
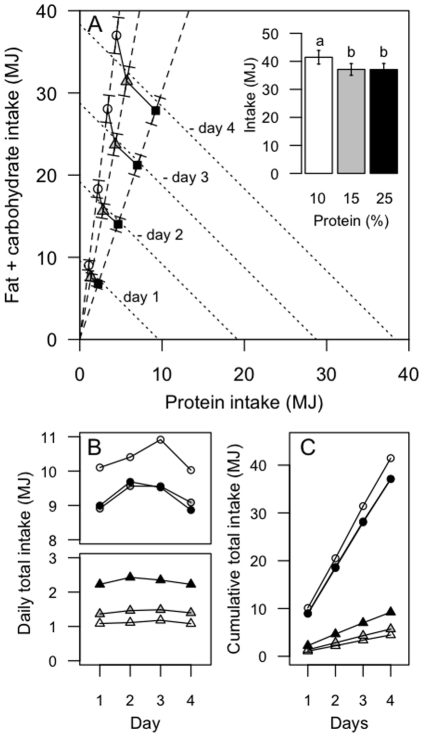
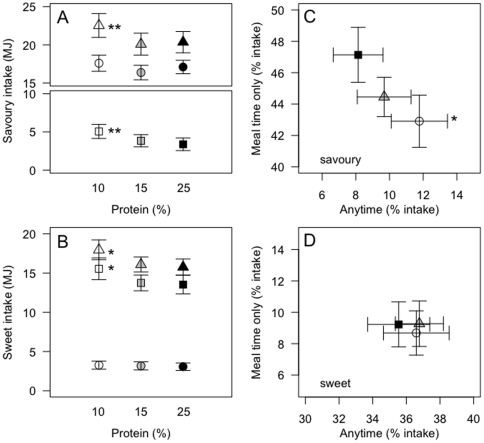
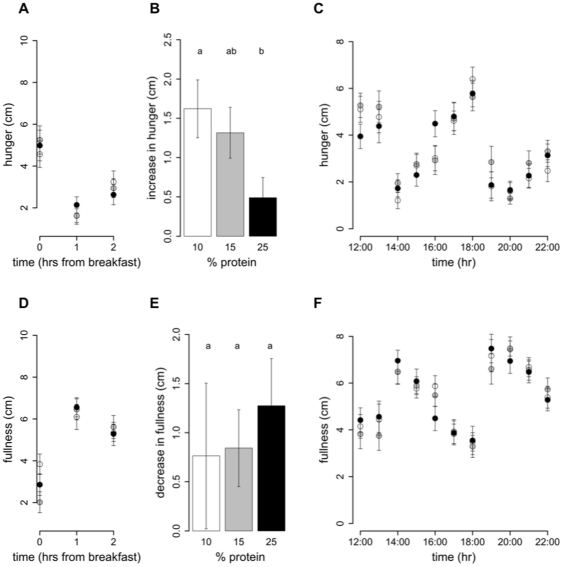
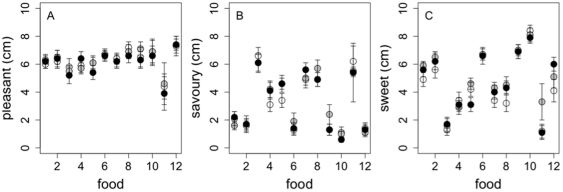
A significant contributor to the rising rates of human obesity is an increase in energy intake. The 'protein leverage hypothesis' proposes that a dominant appetite for protein in conjunction with a decline in the ratio of protein to fat and carbohydrate in the diet drives excess energy intake and could therefore promote the development of obesity. Our aim was to test the 'protein leverage hypothesis' in lean humans by disguising the macronutrient composition of foods offered to subjects under ad libitum feeding conditions. Energy intakes and hunger ratings were measured for 22 lean subjects studied over three 4-day periods of in-house dietary manipulation. Subjects were restricted to fixed menus in random order comprising 28 foods designed to be similar in palatability, availability, variety and sensory quality and providing 10%, 15% or 25% energy as protein. Nutrient and energy intake was calculated as the product of the amount of each food eaten and its composition. Lowering the percent protein of the diet from 15% to 10% resulted in higher (+12±4.5%, p = 0.02) total energy intake, predominantly from savoury-flavoured foods available between meals. This increased energy intake was not sufficient to maintain protein intake constant, indicating that protein leverage is incomplete. Urinary urea on the 10% and 15% protein diets did not differ statistically, nor did they differ from habitual values prior to the study. In contrast, increasing protein from 15% to 25% did not alter energy intake. On the fourth day of the trial, however, there was a greater increase in the hunger score between 1-2 h after the 10% protein breakfast versus the 25% protein breakfast (1.6±0.4 vs 25%: 0.5±0.3, p = 0.005). In our study population a change in the nutritional environment that dilutes dietary protein with carbohydrate and fat promotes overconsumption, enhancing the risk for potential weight gain.
Conflict of interest statement
Figures
Similar articles
-
Protein leverage and energy intake.Obes Rev. 2014 Mar;15(3):183-91. doi: 10.1111/obr.12131. Epub 2013 Oct 28. Obes Rev. 2014. PMID: 24588967
-
Low glycemic index breakfasts and reduced food intake in preadolescent children.Pediatrics. 2003 Nov;112(5):e414. doi: 10.1542/peds.112.5.e414. Pediatrics. 2003. PMID: 14595085 Clinical Trial.
-
Altering the temporal distribution of energy intake with isoenergetically dense foods given as snacks does not affect total daily energy intake in normal-weight men.Br J Nutr. 2000 Jan;83(1):7-14. Br J Nutr. 2000. PMID: 10703459 Clinical Trial.
-
Dietary Patterns and Growth, Size, Body Composition, and/or Risk of Overweight or Obesity: A Systematic Review [Internet].Alexandria (VA): USDA Nutrition Evidence Systematic Review; 2020 Jul. Alexandria (VA): USDA Nutrition Evidence Systematic Review; 2020 Jul. PMID: 35129906 Free Books & Documents. Review.
-
The role of dietary fat in obesity.Int J Obes Relat Metab Disord. 1997 Jun;21 Suppl 3:S2-11. Int J Obes Relat Metab Disord. 1997. PMID: 9225171 Review.
Cited by
-
Match and mismatch: conservation physiology, nutritional ecology and the timescales of biological adaptation.Philos Trans R Soc Lond B Biol Sci. 2012 Jun 19;367(1596):1628-46. doi: 10.1098/rstb.2012.0007. Philos Trans R Soc Lond B Biol Sci. 2012. PMID: 22566672 Free PMC article. Review.
-
Multiomics assessment of dietary protein titration reveals altered hepatic glucose utilization.Cell Rep. 2022 Aug 16;40(7):111187. doi: 10.1016/j.celrep.2022.111187. Cell Rep. 2022. PMID: 35977507 Free PMC article.
-
An integrative approach to dietary balance across the life course.iScience. 2022 Apr 28;25(5):104315. doi: 10.1016/j.isci.2022.104315. eCollection 2022 May 20. iScience. 2022. PMID: 35602946 Free PMC article. Review.
-
A brief review of higher dietary protein diets in weight loss: a focus on athletes.Sports Med. 2014 Nov;44 Suppl 2(Suppl 2):S149-53. doi: 10.1007/s40279-014-0254-y. Sports Med. 2014. PMID: 25355188 Free PMC article. Review.
-
No protein intake compensation for insufficient indispensable amino acid intake with a low-protein diet for 12 days.Nutr Metab (Lond). 2014 Aug 20;11:38. doi: 10.1186/1743-7075-11-38. eCollection 2014. Nutr Metab (Lond). 2014. PMID: 25183991 Free PMC article.
References
-
- Simpson SJ, Raubenheimer D. Obesity: the protein leverage hypothesis. Obes Rev. 2005;6(2):133–142. - PubMed
-
- Simpson SJ, Batley R, Raubenheimer D. Geometric analysis of macronutrient intake in humans: the power of protein? Appetite. 2003;41(2):123–140. - PubMed
-
- Westerterp-Plantenga MS. Fat intake and energy-balance effects. Physiol Behav. 2004;83(4):579–585. - PubMed
-
- FAOSTAT database. Food Balance Sheets [Online]. 2010. Available: http://faostat.fao.org/site/368/default.aspx#ancor. Accessed 2010 Sep 15.
Publication types
MeSH terms
Substances
Grants and funding
LinkOut - more resources
Full Text Sources
Medical
