. 2011;6(10):e26010.
doi: 10.1371/journal.pone.0026010. Epub 2011 Oct 13.

Brain morphological signatures for chronic pain

Affiliations

Brain morphological signatures for chronic pain

Marwan N Baliki et al. PLoS One. 2011.

Abstract

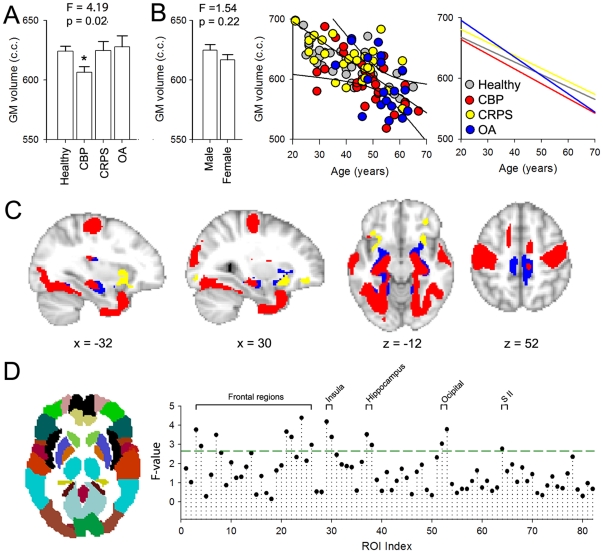
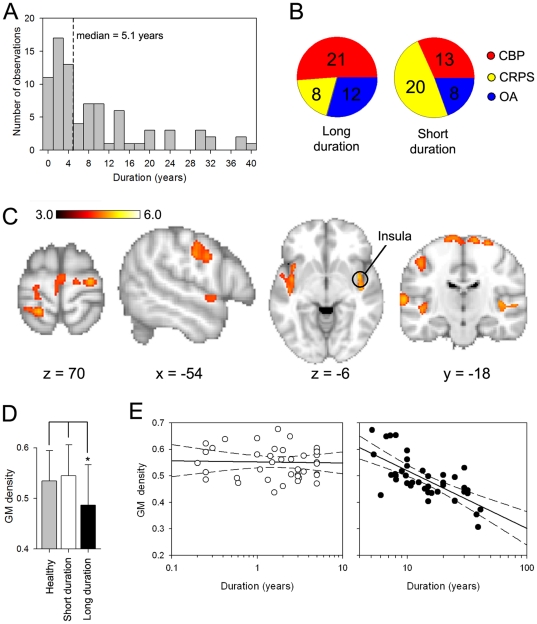
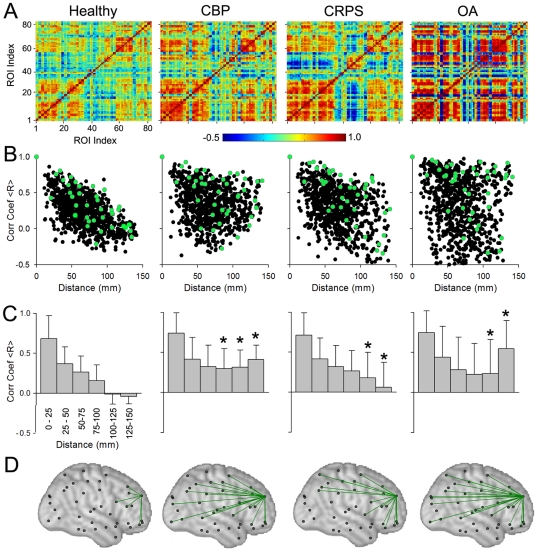
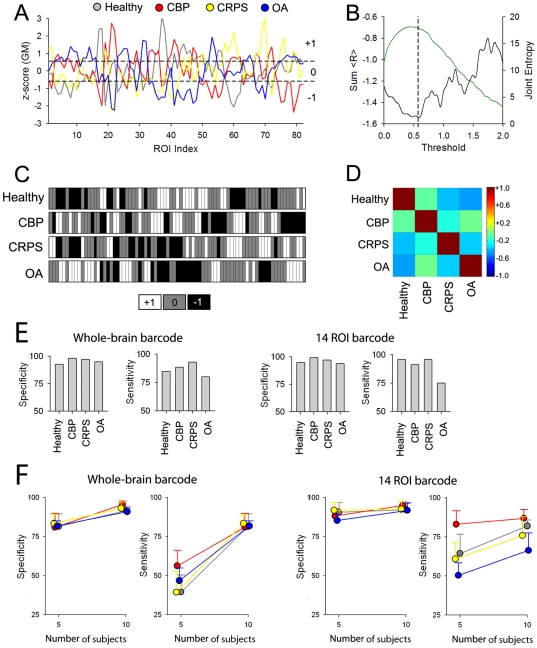
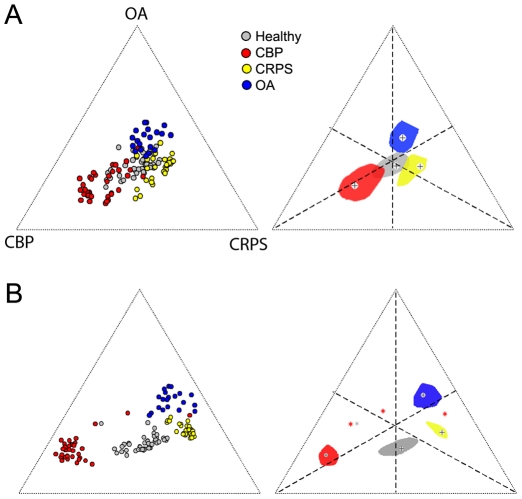
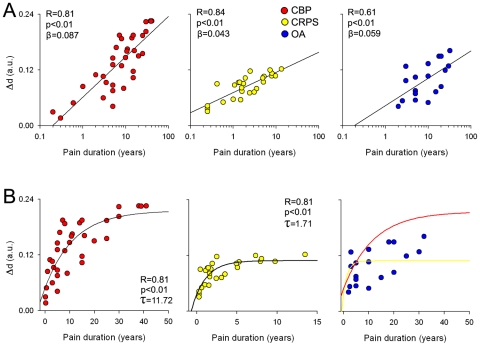
Chronic pain can be understood not only as an altered functional state, but also as a consequence of neuronal plasticity. Here we use in vivo structural MRI to compare global, local, and architectural changes in gray matter properties in patients suffering from chronic back pain (CBP), complex regional pain syndrome (CRPS) and knee osteoarthritis (OA), relative to healthy controls. We find that different chronic pain types exhibit unique anatomical 'brain signatures'. Only the CBP group showed altered whole-brain gray matter volume, while regional gray matter density was distinct for each group. Voxel-wise comparison of gray matter density showed that the impact on the extent of chronicity of pain was localized to a common set of regions across all conditions. When gray matter density was examined for large regions approximating Brodmann areas, it exhibited unique large-scale distributed networks for each group. We derived a barcode, summarized by a single index of within-subject co-variation of gray matter density, which enabled classification of individual brains to their conditions with high accuracy. This index also enabled calculating time constants and asymptotic amplitudes for an exponential increase in brain re-organization with pain chronicity, and showed that brain reorganization with pain chronicity was 6 times slower and twice as large in CBP in comparison to CRPS. The results show an exuberance of brain anatomical reorganization peculiar to each condition and as such reflecting the unique maladaptive physiology of different types of chronic pain.


Conflict of interest statement

Competing Interests: The authors have declared that no competing interests exist.

Figures

Figure 1
Figure 1. Cortical gray matter changes in three chronic pain conditions assessed at multiple scales.
A. Average total neocortical gray matter (GM) volume for the three patient groups, CBP (n = 36), CRPS (n = 28) and OA (n = 30), and healthy controls (n  = 46). Group effect was assessed using an ANCOVA with age, gender and intracranial volume as confounds and was significant (F (4,128)  = 4.19, P  = 0.022). Planned pair-wise contrasts between each chronic pain group and healthy controls showed that only CBP exhibited a significant decrease in total neocortical GM volume (p<0.01). B. Bargraph shows that total neocortical GM volume did not differ by gender across the groups (F (4,128)  = 1.54, P  = 0. 22). Scatter plot presents neocortical GM volume in relation to age for each subject, color-coded by group. All patient groups and healthy controls exhibit a significant negative correlation between neocortical GM volume and age. Right panel shows the slopes computed independently for each group, which did not differ from each other. C. Gray matter morphological changes assessed by voxel based morphometry (VBM). The three groups of patients were contrasted separately to specifically matched healthy controls. Shown are the t-test statistics maps for patients<controls (t-score >3.0, corrected for multiple comparisons across space by permutation testing, clustering determined using TFCE). The three patient groups exhibited distinct cortical patterns of regional gray matter density decreases (CBP  = red, CRPS = yellow, OA = blue). D. Gray matter morphological changes assessed by ROI based GM density comparison. The cortex was subdivided into 82 predefined regions, which approximate the left and right hemisphere Broddmann areas. Gray matter density was averaged across all voxels within each ROI and compared across groups after correcting for age, gender and global brain volume. Plot shows the F-value for across group comparison, green line indicates significance threshold (F (1,124)>2.7). Brain regions above threshold are labeled and include multiple frontal regions, insula, secondary somatosensory cortex (SII), hippocampus, and occipital cortex.
Figure 2
Figure 2. Relationship between Gray matter density and duration of chronic pain.
A) Distribution of pain duration for all patients. Patients were divided into 2 subgroups (short duration and long duration) based on the median (median duration = 5.1 years, dashed line). B) Pie charts show the frequency of each patient population for the 2 subgroups. C) Brain regions that exhibit significant decreased GM density for long duration compared to short duration pain (voxel-wise VBM, unpaired t-test, t-score >3.0, corrected for multiple comparisons across space using permutation testing, clustering determined using TFCE). Regions that showed significant decreases in GM density for longer pain duration included primary sensory and motor regions, as well as insular cortex. D) Bargraph shows the mean +/- SD for GM density for the right insula for the short duration, long duration and healthy groups. Insular mean GM density was significantly less for the long duration group when compared to short duration or healthy groups. E) Scatter plots show the relationship between Insula GM density and duration for the short duration group (left panel, open circles) and long duration (right panel, filled circles). The insula shows a significant relationship with pain duration only in the group when pain was experienced for more than 5 years (R = 0.71, p<0.01).
Figure 3
Figure 3. Cortical structural covariance is specific for different chronic pain groups.
A) Structural covariance was studied by calculating pair-wise correlation of GM density between the 82 ROI-s across subjects separately for healthy controls, CBP, CRPS, and OA, after correcting for age, gender, and total intracranial volume. Resultant correlation matrix shows widespread increases in correlation strength in all three patient groups. B) Scatter plots show the left hemisphere pair-wise correlations (for the 41 ROIs) plotted against mean distance between pairs. Healthy subjects show a linear dependency on distance. This relationship is disrupted in unique ways in each chronic pain condition. Green dots indicate the correlation of one example region to the rest of the brain. C) Bar plots are the same data as in (B) after binning distances into 6 ranges, 25 mm each. Mean +/- SD for pair-wise correlation coefficients are shown for each bin, in each group. Patients show higher correlations between ROIs that are far apart (>100 mm apart; asterisks p<0.01 comparing means for each bin to its counterpart in the healthy controls). D) Spatial illustration of changes in correlation for a frontal cortex ROI (same area illustrated in green in B). Significantly strong connections (r>0.6, p<0.05) are plotted (green lines) on standard brain (black marks are centers of ROIs). Strong connectivity is observed with neighboring regions in the healthy group, while all three chronic pain patient groups show enhanced long distance connections.
Figure 4
Figure 4. The ROI based GM density profile can be transformed into a barcode and used to classify chronic pain patients with high accuracy.
A) The GM density for each ROI was normalized within subject and averaged for each group. The four groups show distinct variations of GM across the brain. Dashed lines are thresholds implemented to tag ROIs to three different classes, high (+1), average (0), or low (−1) GM values. B) Threshold was selected to optimize the difference between groups. Black trace shows the relationship between the sum of R (the sum of the pair-wise correlations coefficients between the barcodes for the 4 groups) and threshold implemented to generate the bar graphs. The green trace represents the amount of information measured as joint entropy for the 4 groups as a function of threshold. The 4 groups showed the most difference at a threshold of 0.56 (vertical dashed line). C) Group barcodes derived for the data in (A) using the selected threshold. D) Pair-wise correlations across the four groups for the selected threshold. All between groups correlations are negative. E) Sensitivity and specificity of correctly identifying individual subjects to their respective group based on the maximum correlation of each barcode with group barcodes. Left panel is when the whole-brain barcode, shown in C, is used. Right panel is the result when 14 ROIs that best discriminate between the groups (shown in Figure 1C) were used. The procedure shows very high specificity and sensitivity, as random classification would correspond to 25% sensitivity and specificity. F) Dependence of sensitivity and specificity on number of brains used to calculate average barcodes. Whole-brain or 14 ROI-based barcodes derived from a subset of subjects per group (5 and 10 respectively) and classification applied to the rest of the subjects. Shown are mean±S.D. of specificity and sensitivity from 10 iterations for random choices of 5 and 10 subject group barcodes. Specificity exhibited robust results for both tests, while sensitivity seemed to be more dependent on the number of subjects used and the specific group tested.
Figure 5
Figure 5. Individual brain and group GM interrelationships based on barcodes.
A) Whole-brain group-averaged barcodes (Figure 4 C, D, E) were used to localize the relative relationship between individual brains (left), and group averages (right). B) Same as A except the barcode is derived from the 14 ROI barcodes (Figure 4 F). The distance from the three poles and from the center (corresponding to healthy controls) was computed from the correlation of individual subject barcode with the 4 group barcodes. Left panels localize individual brains relative to the center (healthy controls) and poles of the equilateral triangle defining the three patient groups. Right panels show the bi-median (cross) and 2-dimensional inter-quartile distances (color contours) of each group relative to the center and poles of the triangle. Different colors represent different groups. Outliers are shown as stars (three CBP and one healthy control brains).
Figure 6
Figure 6. Relating whole-brain GM reorganization to pain chronicity.
A) Scatter plots show the relationship between relative bar-code distances, Δd, for individual patients and duration of chronic pain in CBP (red), CRPS (yellow) and OA (blue). The relative distance was computed as the Euclidean distance between individual patients' location in the ternary plot from the center for the mean of healthy controls (Figure 5A), thus reflecting extent of global gray matter reorganization, where larger distances indicate larger deviations form healthy. All patient groups exhibited a significant correlation between the distance and duration of pain in log scale. B) Same data in A plotted as a linear function of pain duration. Distance relationship to pain duration followed an exponential growth function in CBP (left plot, red circles) and CRPS (middle plot, yellow circles), but not in OA (right) plot. Yellow and red traces in right plot show the best fitted curves for CBP and CRPS respectively.

References

    1. Julius D, Basbaum AI. Molecular mechanisms of nociception. Nature. 2001;413:203–210. - PubMed
    1. Apkarian AV, Baliki MN, Geha PY. Towards a theory of chronic pain. ProgNeurobiol. 2009;87:81–97. - PMC - PubMed
    1. Apkarian AV, Bushnell MC, Treede RD, Zubieta JK. Human brain mechanisms of pain perception and regulation in health and disease. Eur J Pain. 2005;9:463–484. - PubMed
    1. Baliki MN, Geha PY, Apkarian AV, Chialvo DR. Beyond feeling: chronic pain hurts the brain, disrupting the default-mode network dynamics. J Neurosci. 2008;28:1398–1403. - PMC - PubMed
    1. Tagliazucchi E, Balenzuela P, Fraiman D, Chialvo DR. Brain resting state is disrupted in chronic back pain patients. Neurosci Lett. 2010;485:26–31. - PMC - PubMed

Publication types