. 2012 Feb;40(2):131-42.e4.
doi: 10.1016/j.exphem.2011.10.006. Epub 2011 Oct 21.

Role of tumor suppressor p53 in megakaryopoiesis and platelet function

Affiliations

Role of tumor suppressor p53 in megakaryopoiesis and platelet function

Pani A Apostolidis et al. Exp Hematol. 2012 Feb.

Abstract

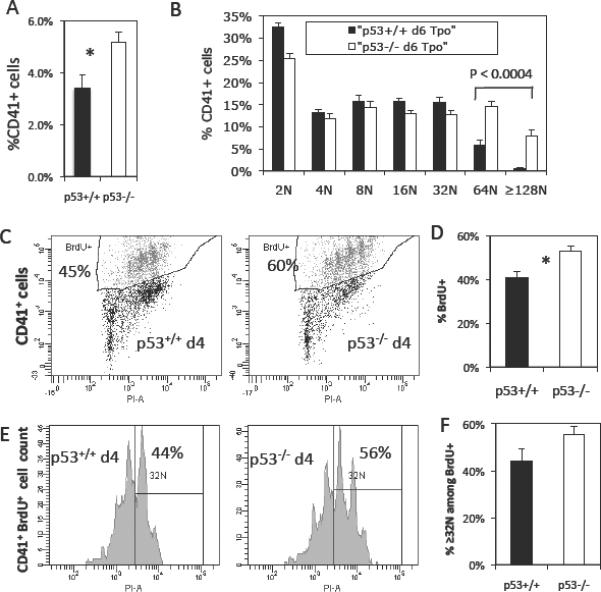
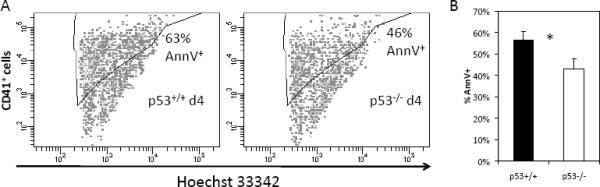
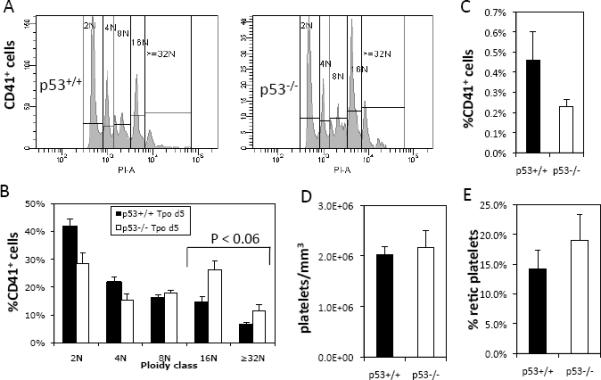
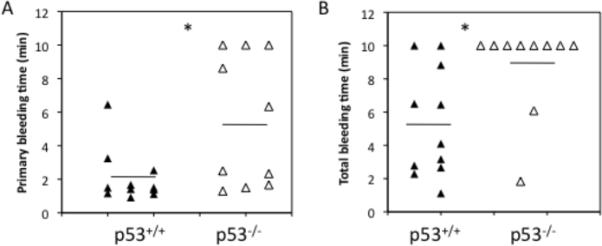
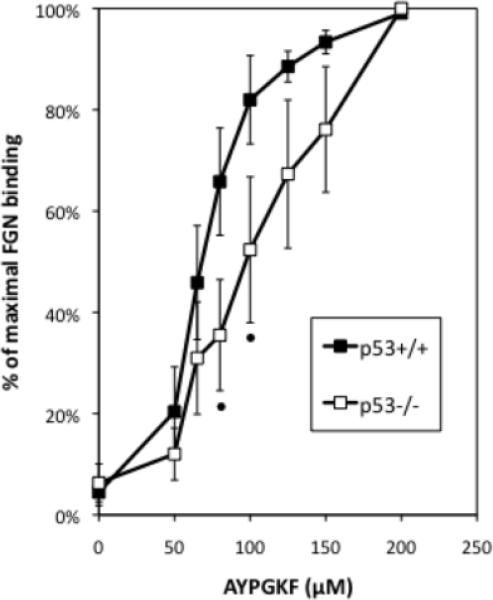
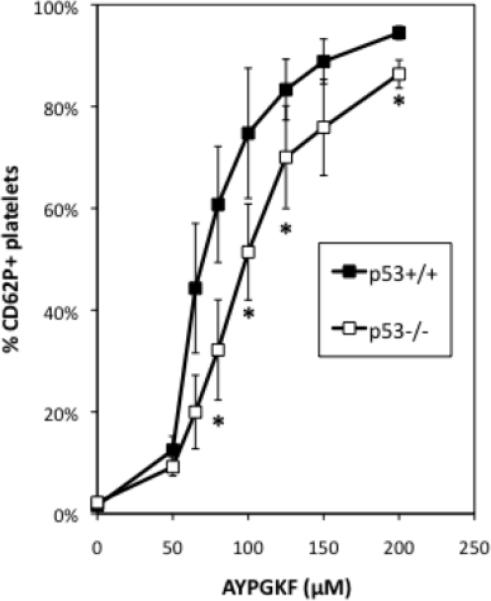
The pathobiological role of p53 has been widely studied, however, its role in normophysiology is relatively unexplored. We previously showed that p53 knock-down increased ploidy in megakaryocytic cultures. This study aims to examine the effect of p53 loss on in vivo megakaryopoiesis, platelet production, and function, and to investigate the basis for greater ploidy in p53(-/-) megakaryocytic cultures. Here, we used flow cytometry to analyze ploidy, DNA synthesis, and apoptosis in murine cultured and bone marrow megakaryocytes following thrombopoietin administration and to analyze fibrinogen binding to platelets in vitro. Culture of p53(-/-) marrow cells for 6 days with thrombopoietin gave rise to 1.7-fold more megakaryocytes, 26.1% ± 3.6% of which reached ploidy classes ≥64 N compared to 8.2% ± 0.9% of p53(+/+) megakaryocytes. This was due to 30% greater DNA synthesis in p53(-/-) megakaryocytes and 31% greater apoptosis in p53(+/+) megakaryocytes by day 4 of culture. Although the bone marrow and spleen steady-state megakaryocytic content and ploidy were similar in p53(+/+) and p53(-/-) mice, thrombopoietin administration resulted in increased megakaryocytic polyploidization in p53(-/-) mice. Although their platelet counts were normal, p53(-/-) mice exhibited significantly longer bleeding times and p53(-/-) platelets were less sensitive than p53(+/+) platelets to agonist-induced fibrinogen binding and P-selectin secretion. In summary, our in vivo and ex vivo studies indicate that p53 loss leads to increased polyploidization during megakaryopoiesis. Our findings also suggest for the first time a direct link between p53 loss and the development of fully functional platelets resulting in hemostatic deficiencies.


Figures

Fig. 1
Fig. 1
Ex-vivo culture of p53−/− progenitor cells with Tpo generates hyperploid megakaryocytic cells in part due to enhanced DNA synthesis. (A) Percent of CD41+ Mk cells on day 6 of culture of p53+/+ and p53−/− pronenitor cells with 50 ng/ml rm Tpo. Error bars: SEM, N=7, * represents P < 0.02, and (B) averaged ploidy data for p53+/+ and p53−/− CD41+ Mk cells on day 6 of Tpo culture. Error bars: SEM, N=7. (C) Representative DNA synthesis data from p53+/+ and p53−/− cultured Mk cells and (D) average of the DNA synthesis data for day 4. Error bars: SEM, N=3–4, * indicates P < 0.03. Polyploidization among the cycling CD41+ Mk cells (BrdU+) on day 4 of Tpo culture. (E) Representative ploidy histograms from BrdU+ p53+/+ and p53−/− cultured Mk cells and (F) average of the % ≥32N polyploid cells among BrdU+ Mk cells for day 4. Error bars: SEM, N=3–4.
Fig. 2
Fig. 2
Ex-vivo cultured p53−/− Mk cells exhibit diminished apoptosis compared to p53+/+ Mk cells on day 4 of Tpo culture. Cells were incubated with 0.01 mM Hoechst 33342, which serves to distinguish nucleated Mk cells from platelets and other CD41+ debris in the culture, stained with anti-CD41 and treated with Annexin V to identify apoptotic Mk cells. (A) Representative apoptosis data from p53+/+ and p53−/− cultured Mk cells and (B) average of the apoptosis data for day 4 of culture. Error bars: SEM, N=3, * indicates P < 0.05.
Fig. 3
Fig. 3
Megakaryopoiesis and platelet production in p53+/+ and p53−/− mice 5 days following Tpo administration. (A) Representative histograms of p53+/+ and p53−/− Mk cell ploidy indicate increased polyploidization in p53−/− Mk cells in vivo. (B) Averaged ploidy of CD41+ Mk cells in the bone marrow indicates increased percentage of p53−/− Mk cells in 16N and ≥32N ploidy classes, P < 0.06. (C) Percent of CD41+ Mk cells in the bone marrow, P = 0.13. (D) Platelet counts and (E) percent reticulated platelets in the circulation. Error bars: SEM, N=3–4.
Fig. 4
Fig. 4
Tail-bleeding assay in less than 10-weeks-old p53+/+ and p53−/− mice following cutting 3-mm off the distal end of the tail. p53+/+ (black triangles) and p53−/− mice (open triangles). (A) Primary tail bleeding times. (B) Total bleeding times. N=10–11. Horizontal lines (drawn to scale) represent the means. * denotes statistical significance, P < 0.02.
Fig. 5
Fig. 5
p53−/− platelets are less sensitive to PAR-4 agonist-induced fibrinogen binding in vitro. % of maximal binding to fluorescently-conjugated fibrinogen by p53+/+ and p53−/− platelets under a range of AYPGKF concentrations assayed by flow cytometry. N=5. Error bars: SEM. Statistical analysis was conducted using a 2-tailed paired Student t-test; • indicates P = 0.01.
Fig. 6
Fig. 6
p53−/− platelets are less sensitive to PAR-4 agonist-induced P selectin (CD62P) secretion onto their surface. Display of secreted P selectin on the surface of p53+/+ and p53−/− platelets after stimulation with a range of AYPGKF concentrations assayed by flow cytometry. N=5, error bars: SEM. Statistical analysis was conducted using a 2-tailed paired Student t-test. * indicates P = 0.05.
Fig. 7
Fig. 7
Differentially expressed Mk/platelet-related genes coding for components of platelet surface receptors, α granules and components of the platelet cytoskeleton. Rows show the probe ID on the Agilent 4x44K whole human genome microarray; expression ratios between p53-KD and control CHRF on day 0 (unstimulated) and days 1, 3, 5 and 7 after PMA stimulation for two biological replicates; the gene name; average median and average maximal/minimal fold difference; and gene description. Saturated red indicates 3-fold up-regulation in p53-KD cells relative to control cells, while saturated green indicates 3-fold down-regulation in p53-KD cells relative to control cells.

References

    1. Vousden KH, Lane DP. p53 in health and disease. Nat Rev Mol Cell Biol. 2007;8:275–283. - PubMed
    1. Dumble M, Moore L, Chambers SM, et al. The impact of altered p53 dosage on hematopoietic stem cell dynamics during aging. Blood. 2007;109:1736–1742. - PMC - PubMed
    1. Liu Y, Elf SE, Miyata Y, et al. p53 regulates hematopoietic stem cell quiescence. Cell Stem Cell. 2009;4:37–48. - PMC - PubMed
    1. TeKippe M, Harrison DE, Chen J. Expansion of hematopoietic stem cell phenotype and activity in Trp53-null mice. Exp Hematol. 2003;31:521–527. - PubMed
    1. Liu Y, Elf SE, Asai T, et al. The p53 tumor suppressor protein is a critical regulator of hematopoietic stem cell behavior. Cell Cycle. 2009;8:3120–3124. - PMC - PubMed

Publication types

Substances