. 2011 Oct 24:12:105.
doi: 10.1186/1471-2202-12-105.

Calcium-stores mediate adaptation in axon terminals of olfactory receptor neurons in Drosophila

Affiliations

Calcium-stores mediate adaptation in axon terminals of olfactory receptor neurons in Drosophila

Meena S Murmu et al. BMC Neurosci. .

Abstract

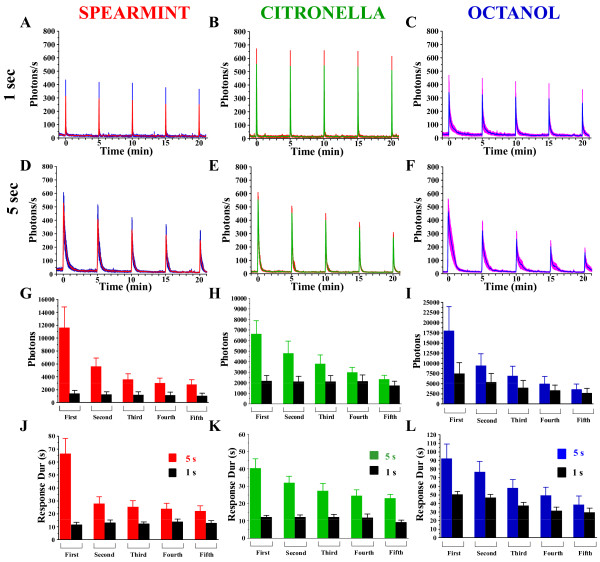
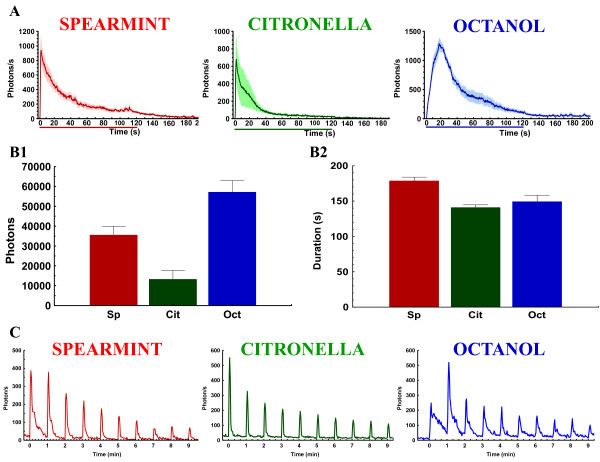
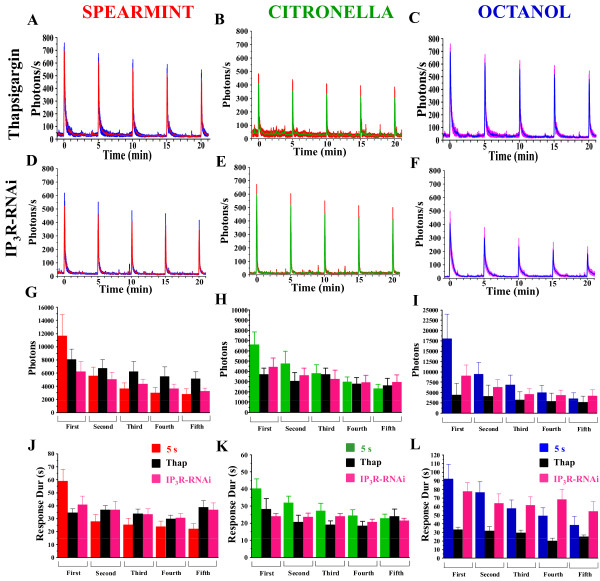
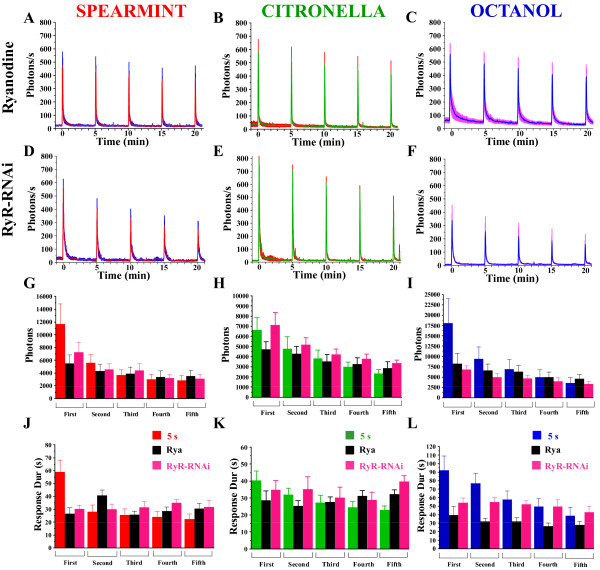
Background: In vertebrates and invertebrates, sensory neurons adapt to variable ambient conditions, such as the duration or repetition of a stimulus, a physiological mechanism considered as a simple form of non-associative learning and neuronal plasticity. Although various signaling pathways, as cAMP, cGMP, and the inositol 1,4,5-triphosphate receptor (InsP3R) play a role in adaptation, their precise mechanisms of action at the cellular level remain incompletely understood. Recently, in Drosophila, we reported that odor-induced Ca2+-response in axon terminals of olfactory receptor neurons (ORNs) is related to odor duration. In particular, a relatively long odor stimulus (such as 5 s) triggers the induction of a second component involving intracellular Ca2+-stores.

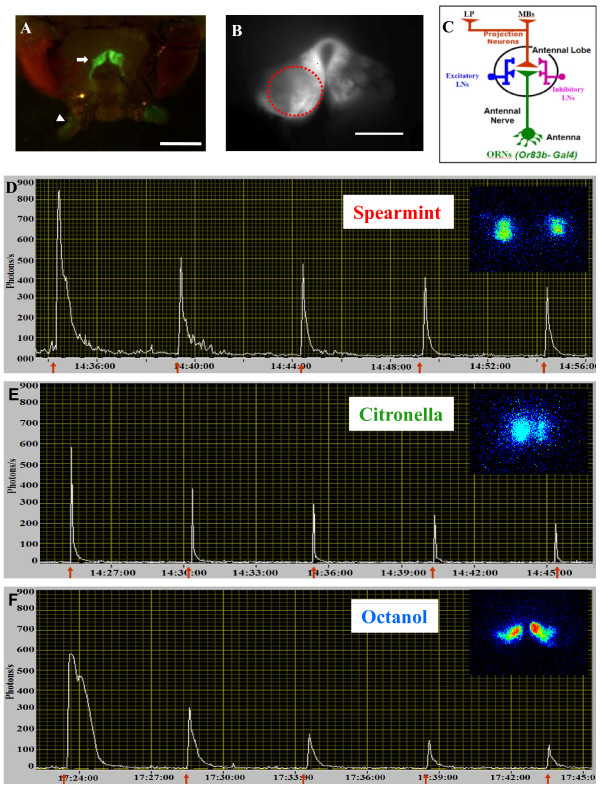
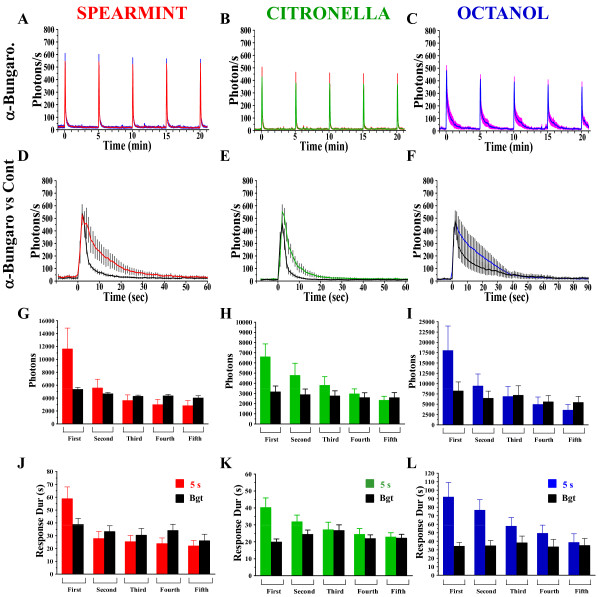
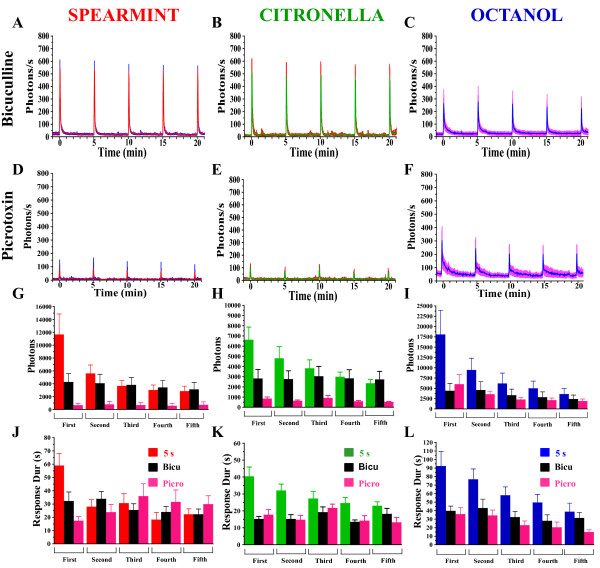
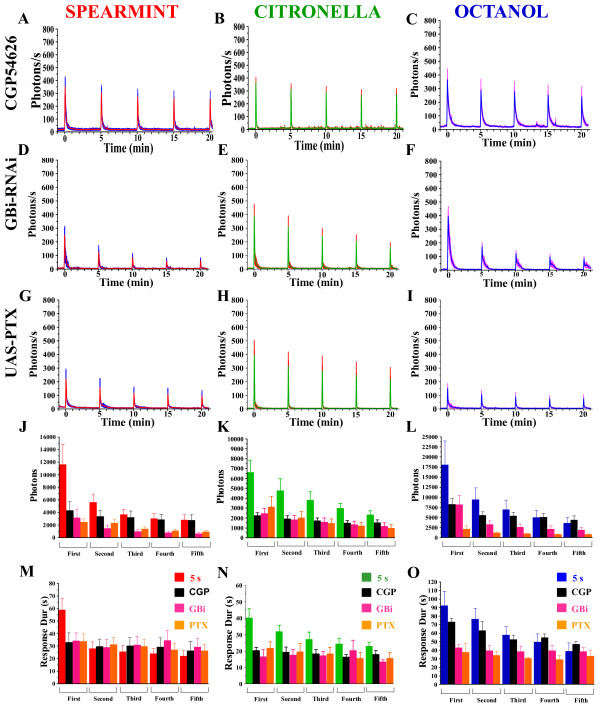
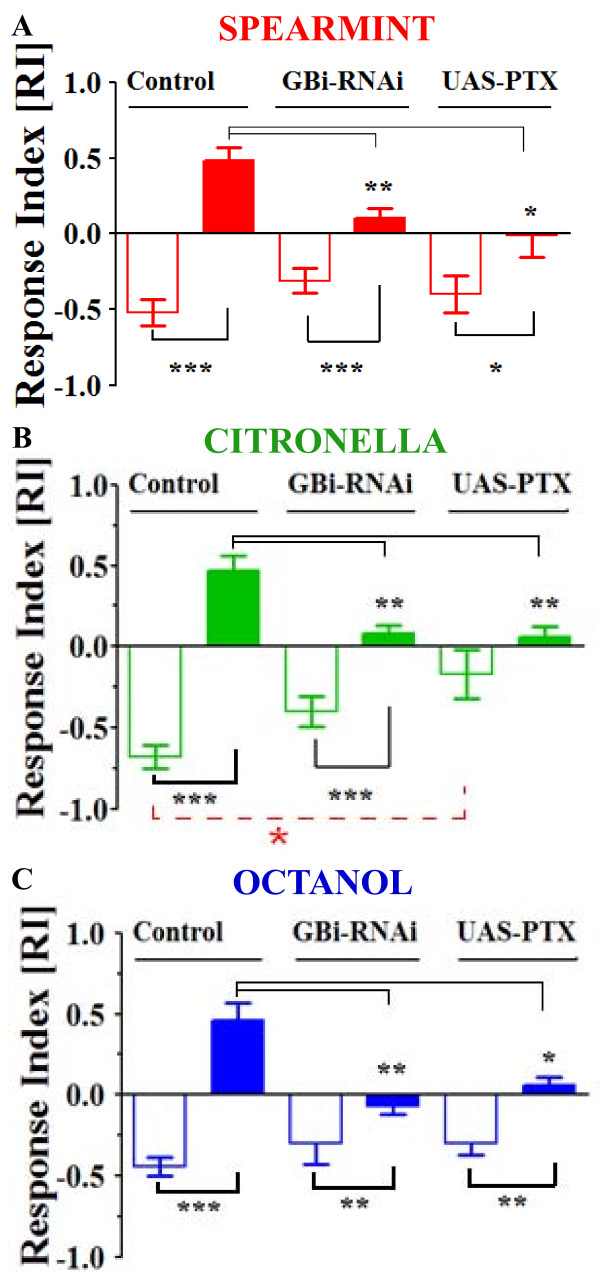
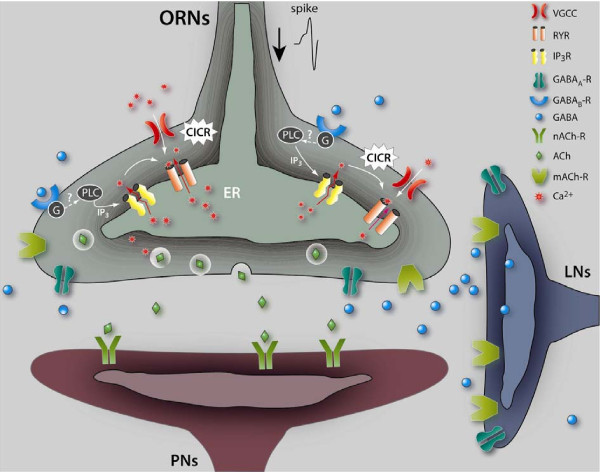
Results: We used a recently developed in-vivo bioluminescence imaging approach to quantify the odor-induced Ca2+-activity in the axon terminals of ORNs. Using either a genetic approach to target specific RNAs, or a pharmacological approach, we show that the second component, relying on the intracellular Ca2+-stores, is responsible for the adaptation to repetitive stimuli. In the antennal lobes (a region analogous to the vertebrate olfactory bulb) ORNs make synaptic contacts with second-order neurons, the projection neurons (PNs). These synapses are modulated by GABA, through either GABAergic local interneurons (LNs) and/or some GABAergic PNs. Application of GABAergic receptor antagonists, both GABAA or GABAB, abolishes the adaptation, while RNAi targeting the GABABR (a metabotropic receptor) within the ORNs, blocks the Ca2+-store dependent component, and consequently disrupts the adaptation. These results indicate that GABA exerts a feedback control. Finally, at the behavioral level, using an olfactory test, genetically impairing the GABABR or its signaling pathway specifically in the ORNs disrupts olfactory adapted behavior.

Conclusion: Taken together, our results indicate that a relatively long lasting form of adaptation occurs within the axon terminals of the ORNs in the antennal lobes, which depends on intracellular Ca2+-stores, attributable to a positive feedback through the GABAergic synapses.


Figures

Figure 1
Figure 1
Odor-induced Ca2+-responses in axon terminals of ORNs of a control fly (Or83b,GA/CS). (A) Combined dim-light and fluorescence images showing the ORNs in the antennae (arrowhead) and their synaptic terminals (arrow) in the antennal lobes (Leica MZ FLIII binocular, Scale bar = 100 μm). (B) Fluorescence image of the antennal lobes taken at the beginning of the experiment and used as reference image. The red-dashed circle represents the ROI (Region of Interest) from which the light emission is quantified (Scale bar = 50 μm). (C) Schematic drawing of the local neuronal network in the antennal lobe. Ca2+ -activity is recorded in the axon terminals of the ORNs (in green), LNs: local interneurons, LP: lateral protocerebrum, MBs: Mushroom-bodies. (D,E,F) A representative bioluminescent Ca2+ -activity profile evoked by 5 applications of 5 s odor duration (red arrow) at 5 min-intervals of spearmint (D), citronella (E), octanol (F). Inset: a bioluminescence image (accumulation time: 10 s) of the first odor application for each odor. We remark that the activated region is different for each odor (odor specific). ORNs response adapts to repeated odor stimulation (see also movie in Additional file 1).
Figure 2
Figure 2
ORNs adapt to long-lasting and repeated odor stimulation. (A-F) Mean (+/- SEM) of amplitude of the response (photons/s) of different flies, versus time, of the Ca2+ -induced response (within the ROI) evoked by 1 s (A,B,C) or 5 s (D,E,F) application of spearmint (red-left column), citronella (green-middle column), or octanol (blue-right column) (Spearmint: red line = mean, blue = SEM) (Citronella: green line = mean, and red = SEM) (Octanol: blue line = mean, red = SEM) (same color-code for Figures 4 to 8). (G-I) Mean of the total number of photons of the 5 successive applications, for each odor. (J-L) Mean of the duration of the response (s). n = 5-9 flies for each condition. Values are means +/- SEM. Statistics: for the Amplitude (A-F): One-Way ANOVA, for the total photons and duration (G-L): Two-Way ANOVA (see Table 1 for complete statistical values). Remark that the ordinates (y-axis) of figures (G-I) and (J-L) have a different scale (also for other figures).
Figure 3
Figure 3
Odor-induced Ca2+-activity is maintained all along the 2-min odor application, and is sensitive to the frequency of the odor-repetition. (A) Mean of the amplitude (+/-SEM) of the response (photons/s) versus time, of the Ca2+-induced response evoked by a long odor application (2 min) (represented by the colored bar below the abscissa) for the three tested odors (n = 6 flies for each odor). Interestingly, we note that the Ca2+-response in the axon terminal is maintained (although it decreases) at least during the 2-min odor application (for each of the three tested odors), but rapidly decreases when the odor application is stopped. (B) Total amount of emitted photons and duration of the response of the 2-min odor application for each odor. The duration of the response is longer than 2 min (Sp = 178 s, Ci = 141 s, Oct = 149 s). C) Amplitude of the response (photons/s) of a representative fly, versus time, of the Ca2+-induced response (within the ROI) evoked by 5 s application of spearmint, citronella, and octanol, repeated 10 times at 1 min-interval. For octanol, we remark that since the duration of the first response is very long (> 60 s), the Ca2+-response of the first odor-application is not yet finished when the second odor application occurs (which likely explains why for the second application, the amplitude is higher than for the first one).
Figure 4
Figure 4
The second component of the Ca2+ -response depends on cholinergic synaptic transmission. Mean (+/- SEM) amplitude of the overall responses (photons/s versus time) of the effect of α-bungarotoxin (Bgt) (A,B,C) on the Ca 2+-induced responses collected from the ROI, evoked by 5 application at 5-min interval, of a 5 s odor-duration of spearmint, citronella or octanol. (G-I) Mean of the total photons for each odor. (J-L) Mean of the duration(s) of the response. (D,E,F) Magnification view of the first odor application, showing the superposition of the Bgt-treated versus control flies (issued from Figure 2D,E,F respectively) for each odor. n = 5-9 flies for each condition. For the histograms (G-L): Values are means +/- SEM. Statistics: same tests as for Figure 2 (see Table 1 for statistical values).
Figure 5
Figure 5
Ca2+-transients in flies with pharmacologically blocked InsP3R or knocked-down InsP3R. Response profiles of thapsigargin-treated flies (A-C), or Or83b,GA/InsP3R-RNAi flies (D-F) to 5 s application of spearmint, citronella, or octanol, applied 5 times at 5 min-interval. Although there is a tendency to decrease, the amplitude of evoked-activity during the repeated stimulations was not significantly different in the presence of thapsigargin or in InsP3R-RNAi-expressing flies for the 3 odors, except for spearmint and octanol in these latter flies. (G-I) Mean of the total photons for each condition. (J-L) Mean of the duration of the response (s). n = 5-9 flies for each condition. Values are means +/- SEM. Statistics: same tests as for Figure 2 (see Table 1 for statistical values).
Figure 6
Figure 6
Ca2+-transients in flies with pharmacologically blocked RyR or knocked-down RyR. Response profiles of ryanodine-treated flies (A-C), or Or83b,GA/RyR-RNAi expressing flies (D-F) to 5 s application of spearmint, citronella, or octanol, applied 5 time, at 5 min-intervals. The decrease of the amplitude of the successive evoked transients was not significant in the presence of ryanodine for the 3 odors, contrary to that for the RyR-RNAi flies. (G-I) Mean of the total photons for each condition. (J-L) Mean of the duration of the response (s). n = 5-9 flies for each condition. Values are means +/- SEM. Statistics: same tests as for Figure 2 (see Table 1 for statistical values).
Figure 7
Figure 7
Ca2+-transients in flies with pharmacologically blocked GABAA receptors. Response profiles of bicuculline (A-C) or picrotoxin-treated flies (D-F) to 5 s application of spearmint, citronella, or octanol, applied 5 times at 5 min-intervals. The amplitudes of odor-evoked activity during the repeated stimulations remain constant for bicuculline for the 3 odors, as well as for picrotoxin, although they are strongly reduced for this last condition. (G-I) Mean of total photons for each condition. (J-L) Mean of the duration of the response (s). n = 5-9 flies for each condition. Values are means +/- SEM. Statistics: same tests as for Figure 2 (see Table 1 for statistical values).
Figure 8
Figure 8
Ca2+-transients in flies with disturbed GABABR or G-proteins within the ORNs. (A) Response profiles of CGP54626-treated flies (A-C), Or83b,GA/GABABR2-RNAi (GBi) (D-F), or Or83b,GA/UAS-PTX flies (G-I) to 5 s application of spearmint, citronella, or octanol, applied 5 times at 5 min-intervals. The amplitudes of activity during the repeated stimulations do not decrease for CGP54626, for the 3 odors, while they are reduced to a large extent for GBi or UAS-PTX flies. (J-L) Mean of total photons for each condition. (M-O) Mean of duration of the response (s). n = 5-9 flies for each condition. Values are means +/-SEM. Statistics: same tests as for Figure 2 (see Table 1 for statistical values).
Figure 9
Figure 9
Behavioral effects induced by disturbing the GABABR or G-proteins within the ORNs. (A,B,C) Response index of flies challenged with either spearmint, citronella or octanol in a T-maze without pre-exposure (hollow bars) or after pre-exposure (filled bars) for 5 min to the same odor. (Cont: Or83b,GA/CS; Or83b,GA/GBi-RNAi and Or83b,GA/UAS-PTX). For all groups, n = 10 batches of 10 flies/batch (100 flies per group). Values are means + SEM. Three types of comparisons have been performed: first, comparisons within the same genotype are made between those without and after pre-exposure; second, comparisons between control and the different genotypes are made for the "without pre-exposure condition" (all groups are non significant, except UAS-PTX for citronella); and third, comparisons between control and the different genotypes are made for the "after pre-exposure condition" (all groups are significantly different). (* P < 0,05; ** P < 0,001; *** P < 0,0001, Mann-Whitney U-test).
Figure 10
Figure 10
Schematic model of synaptic interactions within the antennal lobes. Spikes (action potentials) triggered by odors in ORNs propagate to the axon terminals, where they activate the VGCCs yielding to Ca2+-influx that serves as an intracellular signal to release the neurotransmitter (acetylcholine: Ach). This Ca2+-entry may also trigger Calcium-Induced Calcium-Release (CICR) through the ryanodine receptor (RyR) located in the endoplasmic reticulum (ER), amplifying the Ca2+-transient [34]. Subsequently, the released-Ach activates the AchR located on the post-synaptic neurons (projection neurons: PNs). Released-Ach might also activate (directly or indirectly) the GABAergic local interneurons (LNs) (in a manner that remains to be precisely determined), in-turn, releasing the GABA that may act on the presynaptic ORN terminals via the GABA receptors. Metabotropic GABABR which has been reported on the axon terminals of the ORNs [28] may activate certain G-proteins (not yet precisely characterized in the ORNs), which for a relatively long odor application, such as 5 s (as in this study) might trigger the second component of the Ca2+ -response by activating directly or indirectly the InsP3R (since blocking the G-proteins by the pertussis-toxin yields a similar effect to blocking directly the GABABR). Therefore, we hypothesize that the GABABR activated G-proteins might activate (directly or putatively indirectly through membrane channels) a phospholipase C (PLC) to catalyze the synthesis of diacylglycerol and InsP3 from PIP2 (phospho-inositol bis-phosphate). Interestingly, a former study has described a role for Gqα, and phospholipase Cβ in insect olfactory transduction [66]. Activation of GABABR in the ORN terminals might lead to InsP3-mediated Ca2+ -release from the ER that could in turn also trigger CICR through RyR as a putative second step to amplify or maintain the Ca2+ -transient. Some components of this pathway still remain to be investigated, such as the putative phospholipase C, as well as the different isoforms of G-proteins, and notably the Gqα. In addition, our pharmacological results provide evidence that blocking the GABAAR disturbs the Ca2+-response within the ORNs to a large degree. However, which neurons in the antennal lobes express the ionotropic GABAAR has not yet been reported. Whether the GABAAR-effect occurs directly or indirectly on the ORNs remains to be investigated. Note that in this model the localization of the AchR (both muscarinic and nicotinic) and GABAAR are speculative, and remain to be determined.

Similar articles

Cited by

References

    1. Torre V, Ashmore JF, Lamb TD, Menini A. Transduction and adaptation in sensory receptor cells. J Neurosci. 1995;15:7757–7768. - PMC - PubMed
    1. Getchell TV, Shepherd GM. Adaptive properties of olfactory receptors analysed with odour pulses of varying durations. J Physiol. 1978;282:541–560. - PMC - PubMed
    1. Firestein S, Picco C, Menini A. The relation between stimulus and response in olfactory receptor cells of the tiger salamander. J Physiol. 1993;468:1–10. - PMC - PubMed
    1. Wang HW, Wysocki CJ. Gold GH Induction of olfactory receptor sensitivity in mice. Science. 1993;260:998–1000. doi: 10.1126/science.8493539. - DOI - PubMed
    1. Ekman G, Berglund B, Berglund U, Lindvall T. Perceived intensity of odor as a function of time of adaptation. Scand J Psychol. 1967;8:177–186. doi: 10.1111/j.1467-9450.1967.tb01392.x. - DOI - PubMed

Publication types

MeSH terms

LinkOut - more resources