. 2012 Feb;45(2):671-82.
doi: 10.1016/j.nbd.2011.10.006. Epub 2011 Oct 17.

The NMDA receptor co-agonists, D-serine and glycine, regulate neuronal dendritic architecture in the somatosensory cortex

Affiliations

The NMDA receptor co-agonists, D-serine and glycine, regulate neuronal dendritic architecture in the somatosensory cortex

Darrick T Balu et al. Neurobiol Dis. 2012 Feb.

Abstract

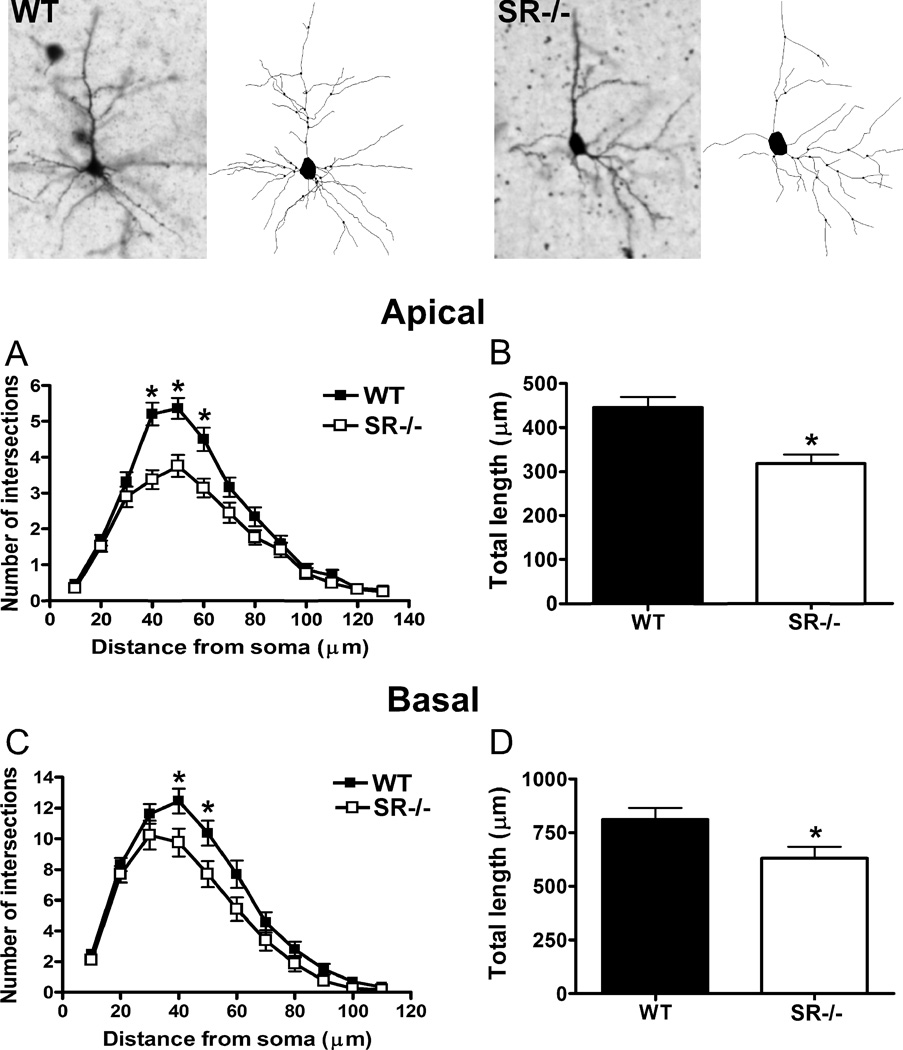
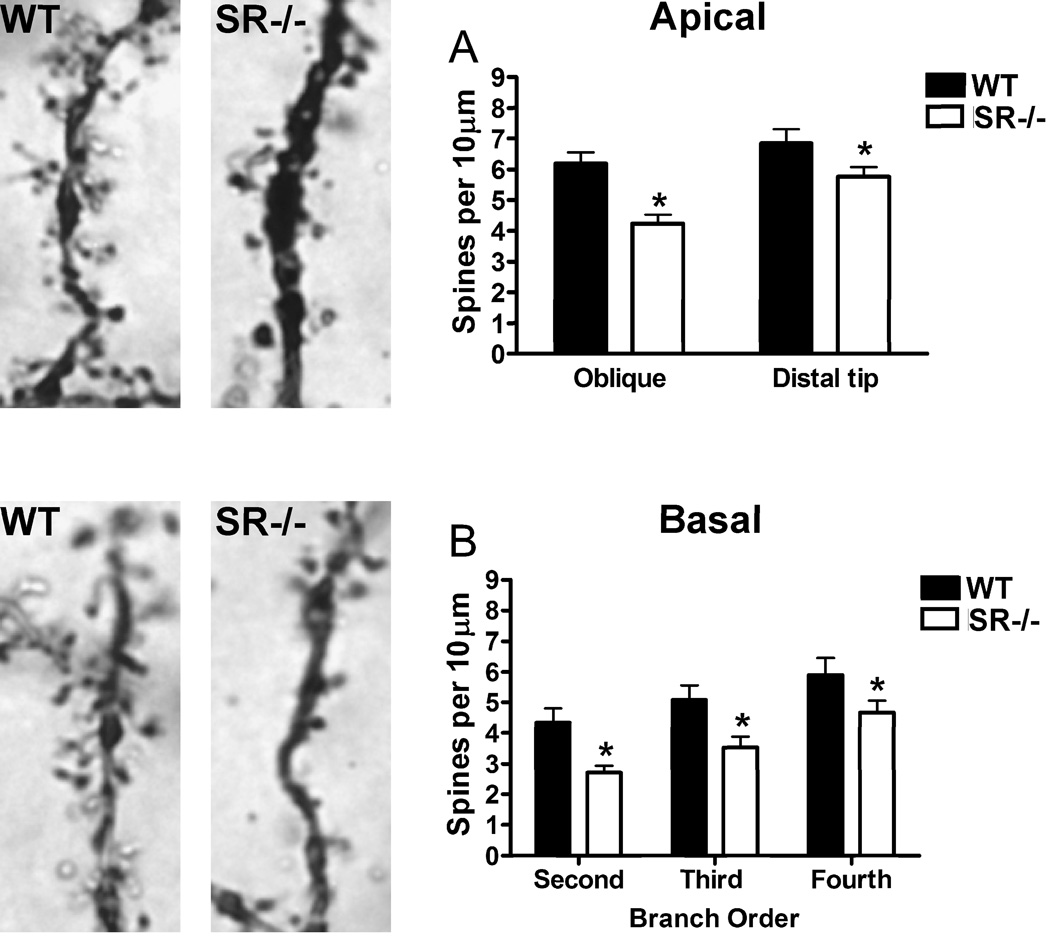
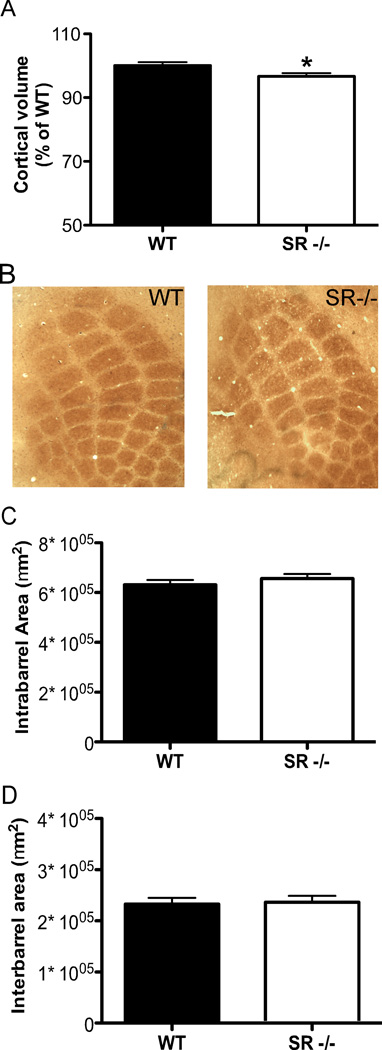
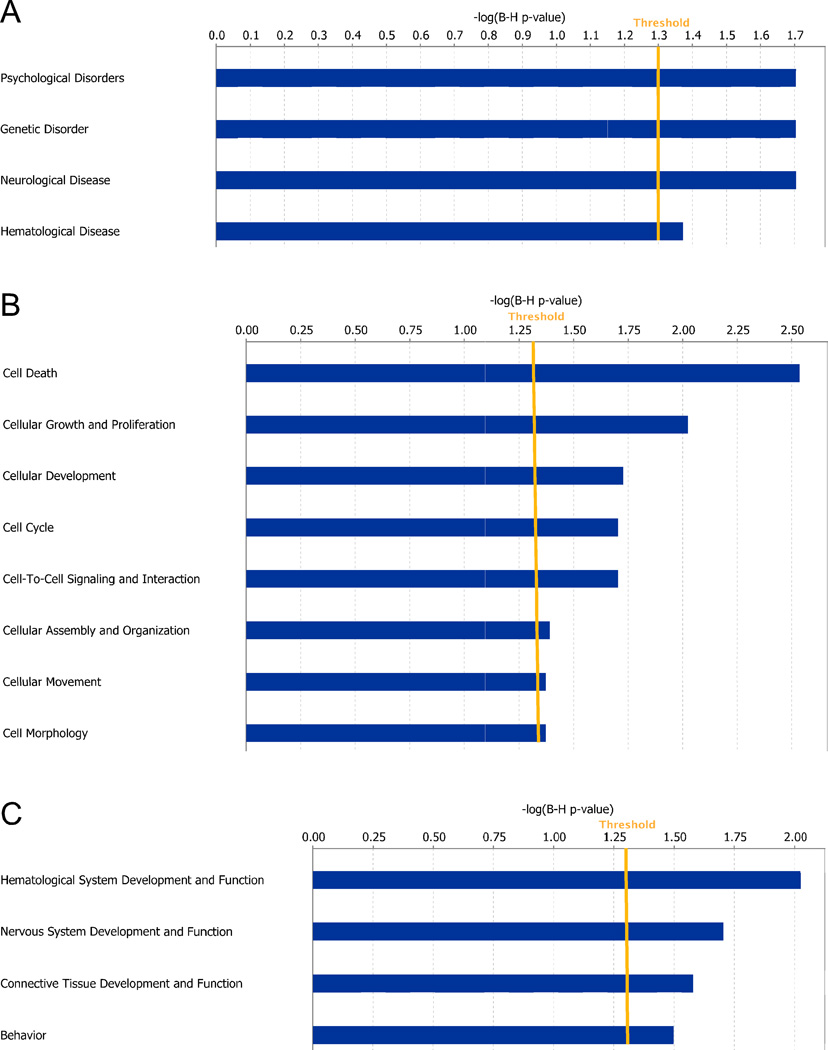
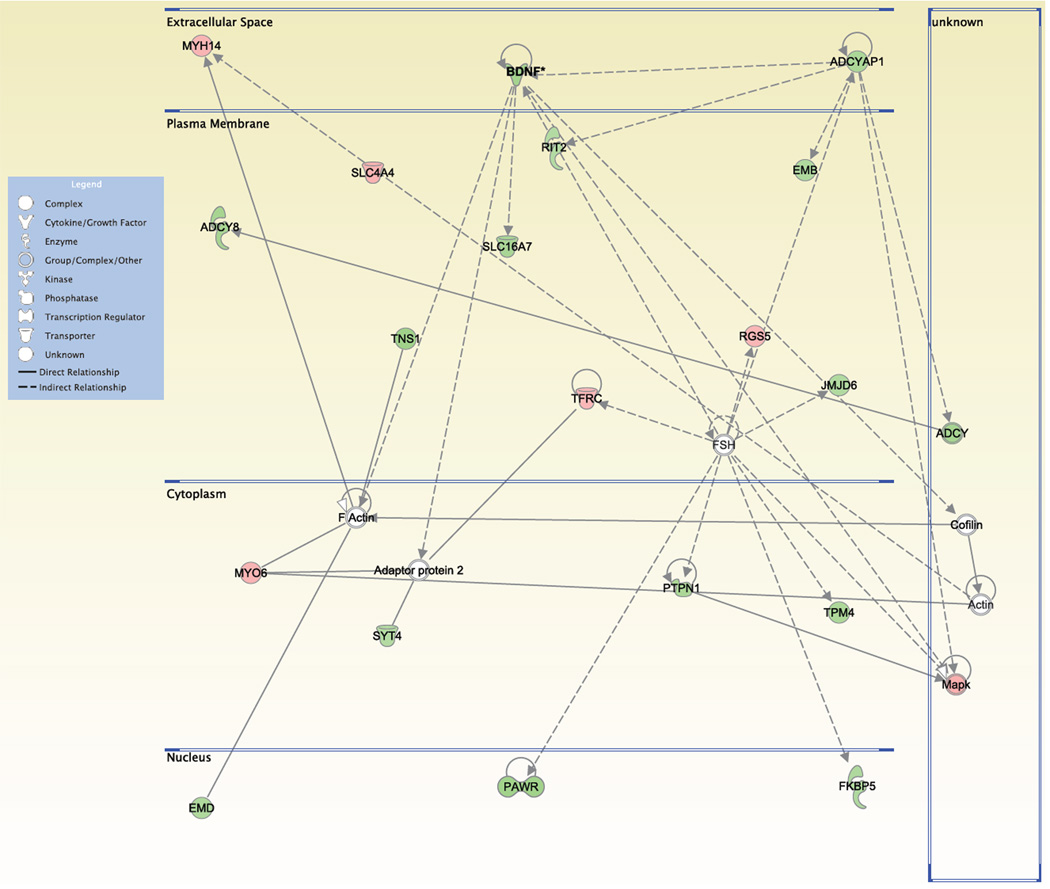
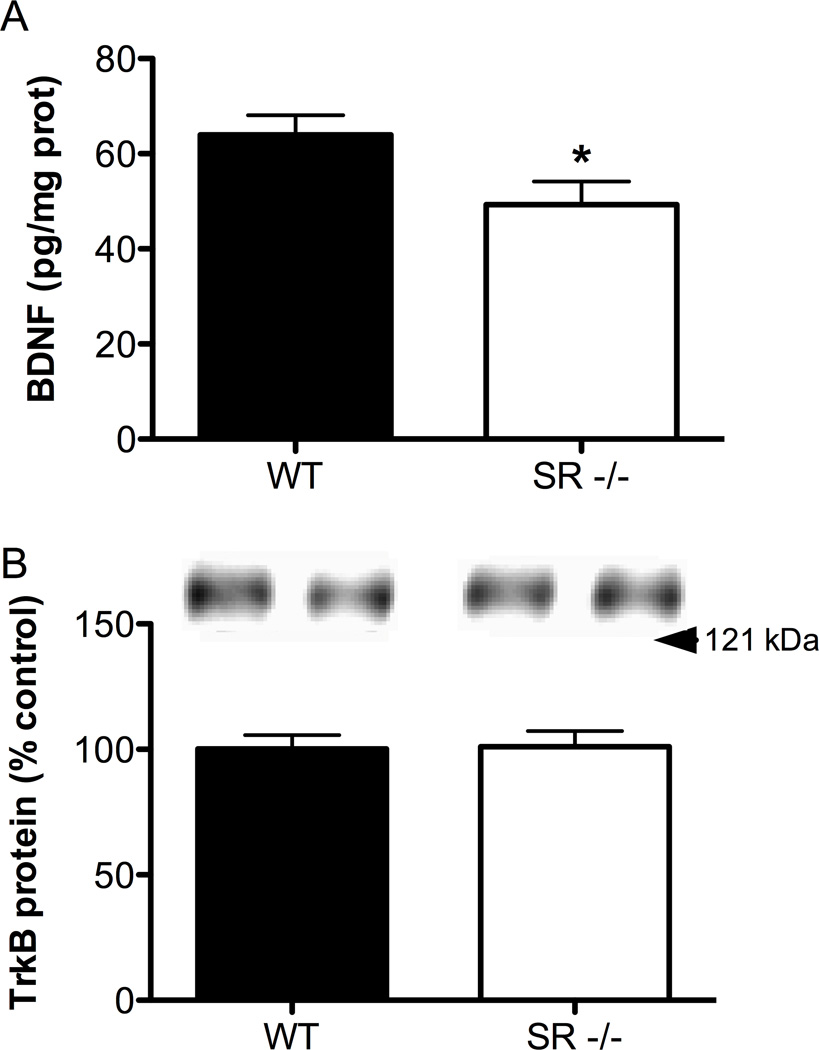
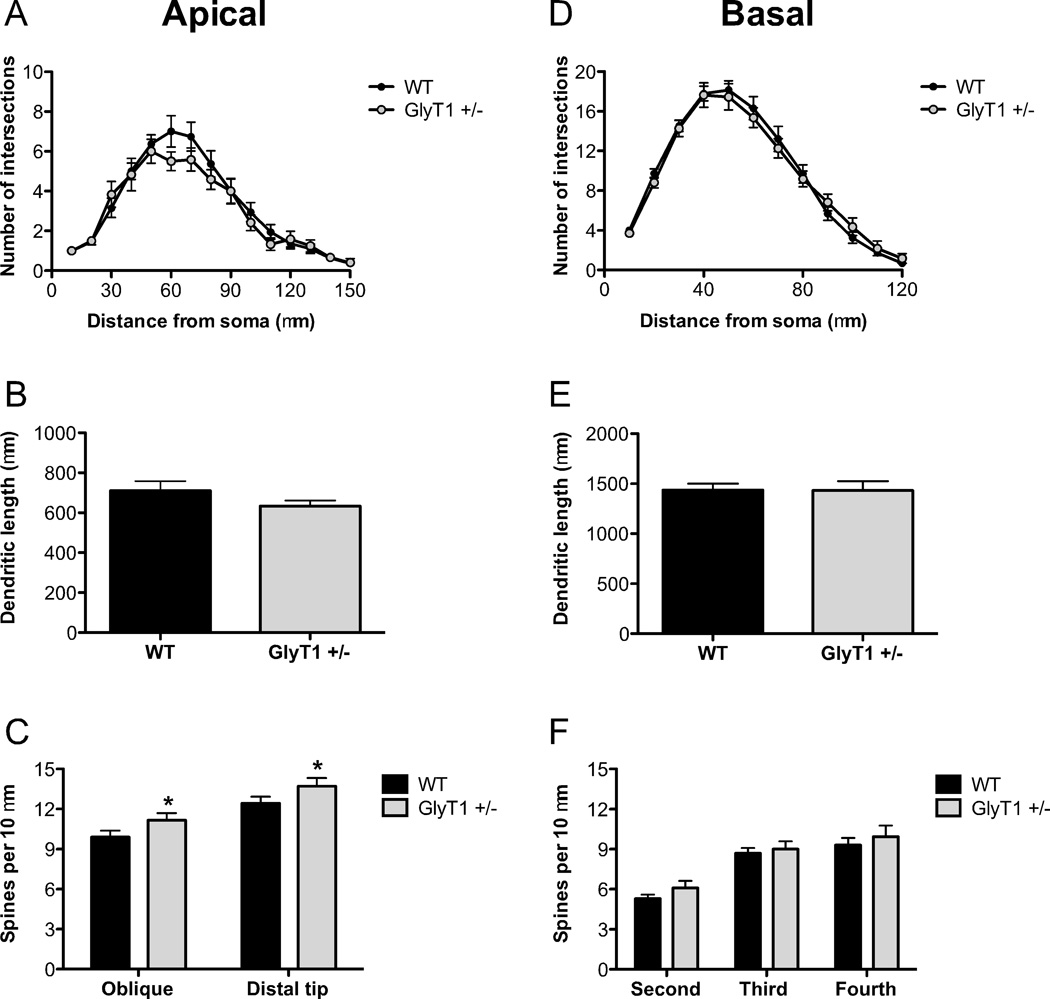
There is substantial evidence, both pharmacological and genetic, that hypofunction of the N-methyl-d-aspartate receptor (NMDAR) is a core pathophysiological feature of schizophrenia. There are morphological brain changes associated with schizophrenia, including perturbations in the dendritic morphology of cortical pyramidal neurons and reduction in cortical volume. Our experiments investigated whether these changes in dendritic morphology could be recapitulated in a genetic model of NMDAR hypofunction, the serine racemase knockout (SR-/-) mouse. Pyramidal neurons in primary somatosensory cortex (S1) of SR-/- mice had reductions in the complexity, total length, and spine density of apical and basal dendrites. In accordance with reduced cortical neuropil, SR-/- mice also had reduced cortical volume as compared to wild type mice. Analysis of S1 mRNA by DNA microarray and gene expression analysis revealed gene changes in SR-/- that are associated with psychiatric and neurologic disorders, as well as neurodevelopment. The microarray analysis also identified reduced expression of brain derived neurotrophic factor (BDNF) in SR-/- mice. Follow-up analysis by ELISA confirmed a reduction of BDNF protein levels in the S1 of SR-/- mice. Finally, S1 pyramidal neurons in glycine transporter heterozygote (GlyT1+/-) mutants, which display enhanced NMDAR function, had increased dendritic spine density. These results suggest that proper NMDAR function is important for the arborization and spine density of pyramidal neurons in cortex. Moreover, they suggest that NMDAR hypofunction might, in part, be contributing to the dendritic and synaptic changes observed in schizophrenia and highlight this signaling pathway as a potential target for therapeutic intervention.


Figures

Fig. 1
Fig. 1
Pyramidal neurons in the somatosensory cortex of SR−/− mice display perturbations in apical and basilar dendritic morphology. The apical and basal dendrites of pyramidal neurons (3–8 neurons/subject) in the cortex from wild-type (WT; n= 6 mice; black) and SR−/− (n = 6 mice; white) animals were compared. Golgi stained pyramidal neurons and computer-assisted reconstructions of representative neurons in WT (left panel) and SR−/− (right panel) mice. (A), The apical dendrites of neurons from SR−/− mice were significantly less complex than WT mice between 40–60 µm from the soma. (B), The total dendritic length of neurons in SR−/− mice was significantly less than WT mice. The basal dendrites of neurons from SR−/− mice also showed significant reductions in (C), complexity (40–50 µm from the soma) and (D), total length. Asterisk (*) indicates significant difference from the WT group (p < 0.05). All values represent the mean ± SEM.
Fig. 2
Fig. 2
Reduced apical and basilar spine densities on pyramidal neurons in the somatosensory cortex of SR−/− mice. Spine density was compared between wild-type (WT; n= 6 mice; black) and SR−/− (n = 6 mice; white) animals. Apical dendritic spines on a Golgi-stained pyramidal neuron in a WT (top left panel) and a SR−/− mouse (top right panel). (A), Spine density on pyramidal neurons (3–5 neurons/subject) was reduced on both oblique branches and the distal tips of apical dendrites in SR−/− mice. Basilar dendritic spines on a Golgi-stained pyramidal neuron in a WT (bottom left panel) and a SR−/− mouse (bottom right panel). (D), Spine density on neurons (3–5 neurons/subject) was reduced across all branch orders of basal dendrites in SR−/−mice. Spine density was expressed as the number of spines per 10 µm of dendrite. Asterisk (*) indicates significant difference from the WT group (p < 0.05). All values represent the mean ± SEM.
Fig. 3
Fig. 3
Cortical volume is reduced in SR−/− mice without changes in the patterning of the PSMBF. (A), The entire cortical volume was measured in wild-type (WT; n = 17; black bars) and SR−/− (n = 20; white bars) mice using stereological techniques of Nissl-stained coronal brain sections. (B), Cytochrome oxidase staining of flattened cortex was used to visualize barrels in the PMBSF of wild-type (WT; left panel) and SR−/− (right panel) mice. (C–D), The area of the barrels in each row (C) and the area between the barrel rows (D) were measured for (WT; n = 8; black bars) and SR−/− (n = 10; white bars) mice. Asterisk (*) indicates significant difference from the WT group (p < 0.05). All values represent the mean ± SEM.
Fig. 4
Fig. 4
Network and cellular function changes in the S1 cortex of SR−/− mice following posthoc analysis of microarray gene expression data. Microarray gene expression data were obtained from wild-type (WT) and SR−/− mice (n = 6/genotype). Genes that showed significant expression changes in SR−/− mice were input into Ingenuity Pathway Analysis (IPA) software for functional analysis. (A–C) Bars represent the level of significance for each category with respect to diseases and disorders (A), molecular and cellular functions (B), and physiological system development and function (C). The orange line indicates the threshold (p < 0.05) for significant category enrichment following correction for multiple comparisons.
Fig. 5
Fig. 5
Graphical representation of molecules associated with BDNF whose expression is altered in SR−/− mice. Using the significant gene expression changes obtained from the microarray, IPA generated a graphical representation of the molecular relationships between molecules related to BDNF. Molecules are represented as nodes, and the biological relationship between two nodes is represented as an edge (line). The intensity of the node color indicates the degree of up- (red) or down- (green) regulation. Nodes are displayed using various shapes that represent the functional class of the gene product (see Legend). Edges are displayed with various labels that describe the nature of the relationship between the nodes.
Fig. 6
Fig. 6
BDNF protein levels are reduced in the S1 cortex of SR−/− mice, without alterations in TrkB levels. (A), BNDF protein levels were measured in S1 cortex of wild-type (WT; n = 7; black bars) and SR−/− (n = 6; white bars) mice using ELISA. Values are expressed as pg of BDNF / mg of protein. (B), TrkB protein levels were measured using Western blot from the same samples used to measure BDNF. Values are expressed as the optical density (OD) normalized to WT values (% control). Asterisk (*) indicates significant difference from the WT group (p < 0.05). All values represent the mean ± SEM.
Fig. 7
Fig. 7
Pyramidal neurons in the somatosensory cortex of GlyT1+/− mice have increased apical dendritic spine density. The apical and basal dendrites of pyramidal neurons in S1 from wild-type (WT; n= 6 mice; black) and GlyT1+/− (n = 6 mice; gray) animals were compared. (A–B), There were no differences in the complexity of apical dendrites ((A)) or total apical dendritic length (B). (C), Spine density was increased in GlyT1+/− mice on both the distal portion and oblique branches of the apical dendrite. (D–F), There were no differences in the complexity of basal dendrites (D), total basal dendritic length (E), or spine density (F) of neurons from GlyT1+/− mice. Asterisk (*) indicates significant difference from the WT group (p < 0.05). All values represent the mean ± SEM.

References

    1. Balu DT, Coyle JT. Glutamate receptor composition of the post-synaptic density is altered in genetic mouse models of NMDA receptor hypo- and hyperfunction. Brain Res. 2011a;1392:1–7. - PMC - PubMed
    1. Balu DT, Coyle JT. Neuroplasticity signaling pathways linked to the pathophysiology of schizophrenia. Neurosci Biobehav Rev. 2011b;35:848–870. - PMC - PubMed
    1. Bass NJ, et al. Evidence for the association of the DAOA (G72) gene with schizophrenia and bipolar disorder but not for the association of the DAO gene with schizophrenia. Behav Brain Funct. 2009;5:28. - PMC - PubMed
    1. Basu AC, et al. Targeted disruption of serine racemase affects glutamatergic neurotransmission and behavior. Mol Psychiatry. 2009;14:719–727. - PMC - PubMed
    1. Binder DK, Scharfman HE. Brain-derived neurotrophic factor. Growth Factors. 2004;22:123–131. - PMC - PubMed

Publication types

MeSH terms