Review
. 2011 Sep-Oct;6(5):346-69.
doi: 10.1002/cmmi.455.

Advanced contrast nanoagents for photoacoustic molecular imaging, cytometry, blood test and photothermal theranostics

Affiliations
Review

Advanced contrast nanoagents for photoacoustic molecular imaging, cytometry, blood test and photothermal theranostics

Adam de la Zerda et al. Contrast Media Mol Imaging. 2011 Sep-Oct.

Abstract

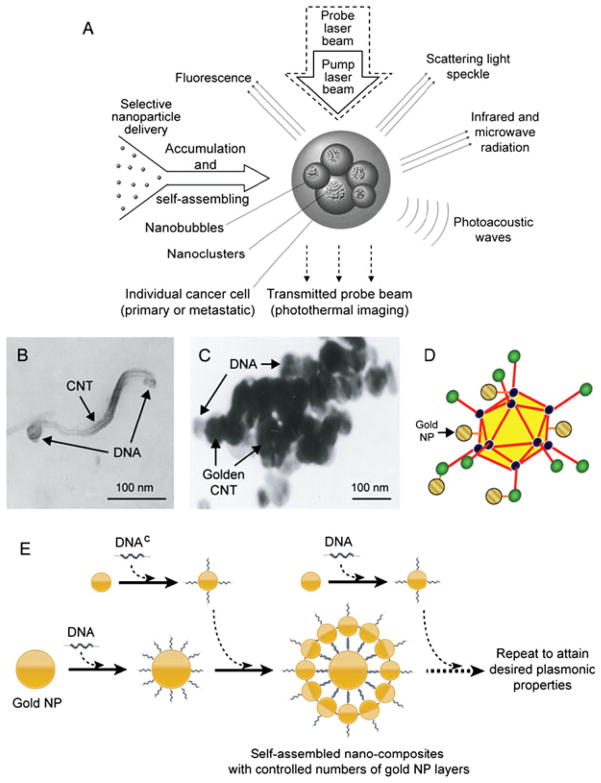
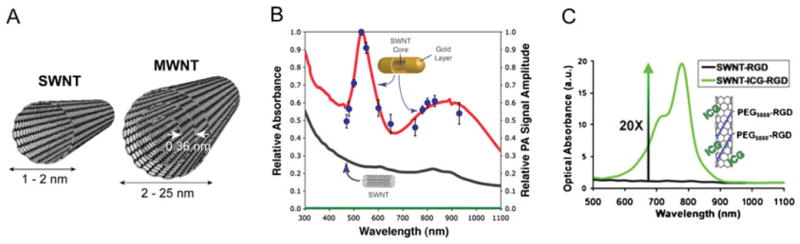
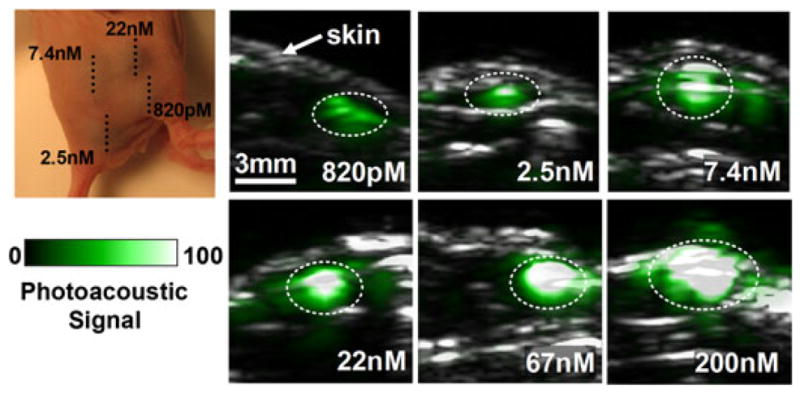
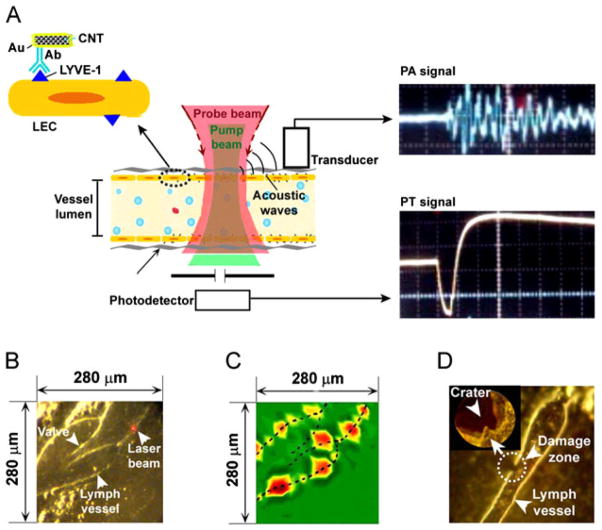
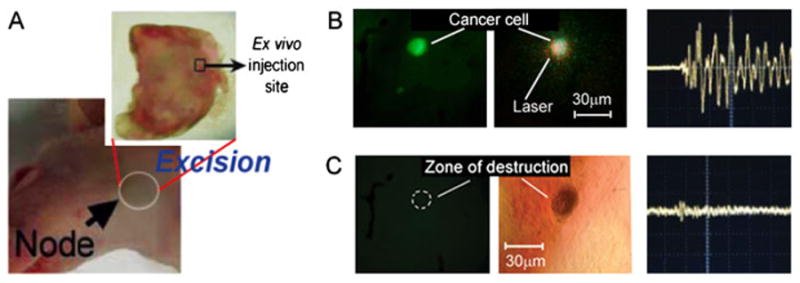
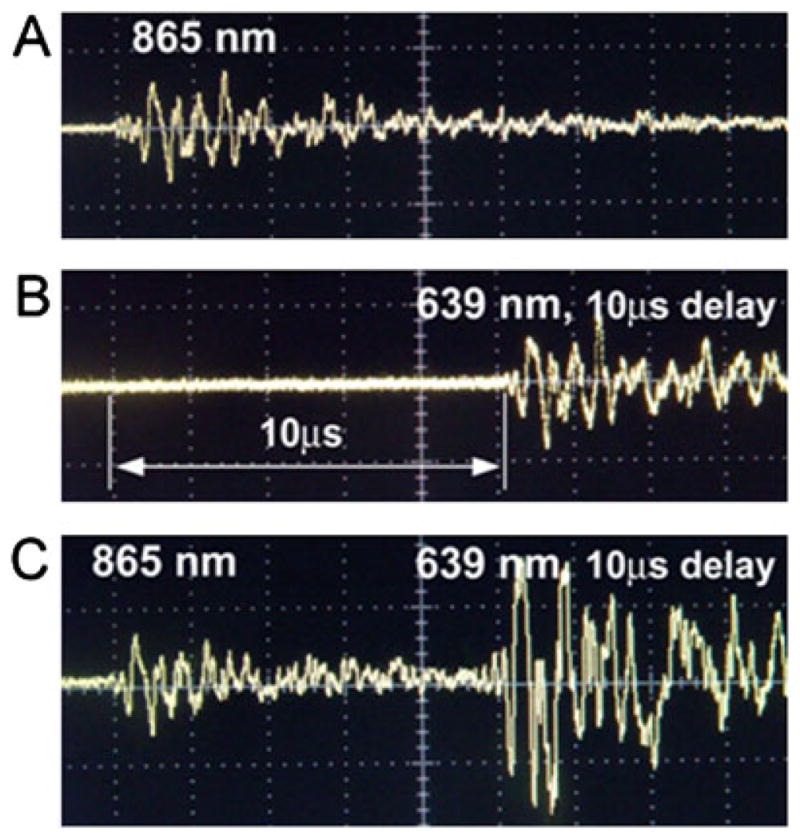
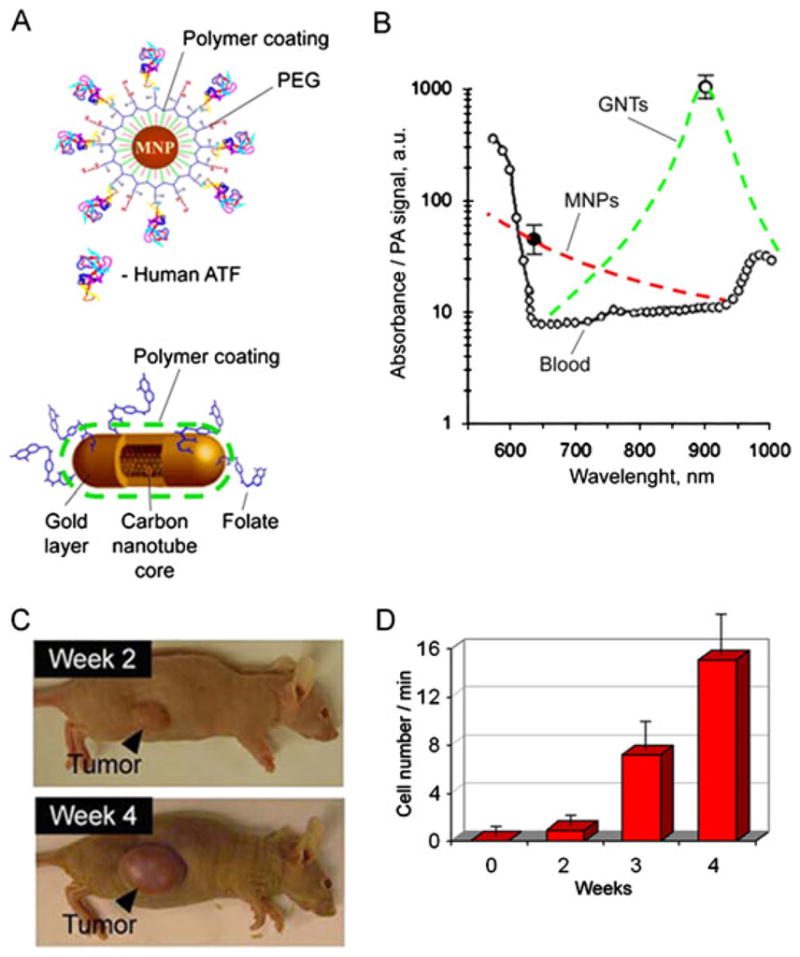
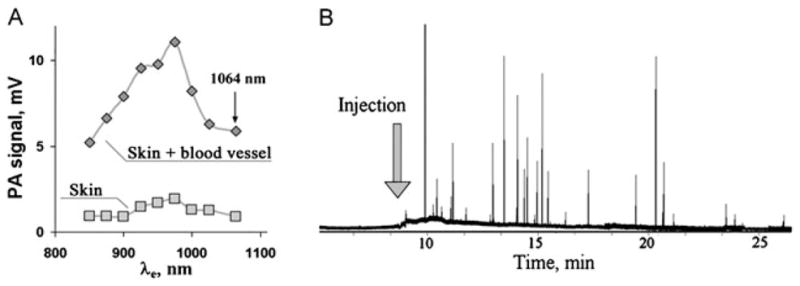
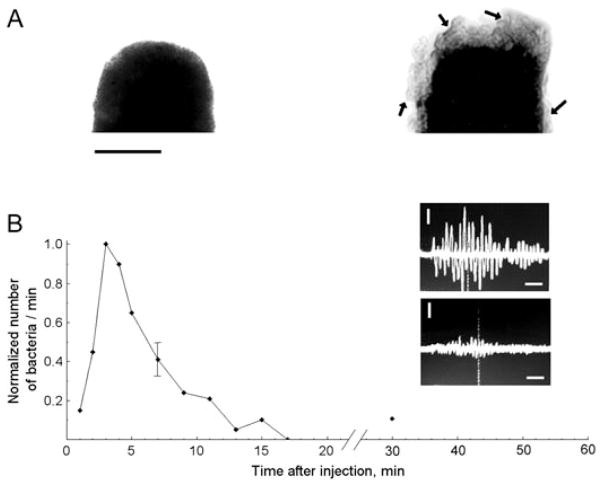
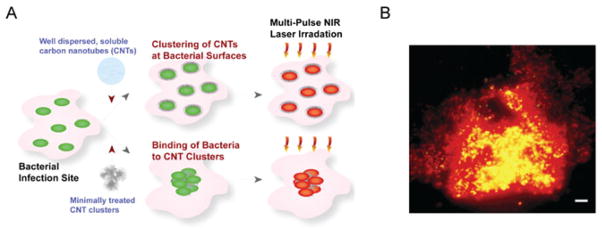
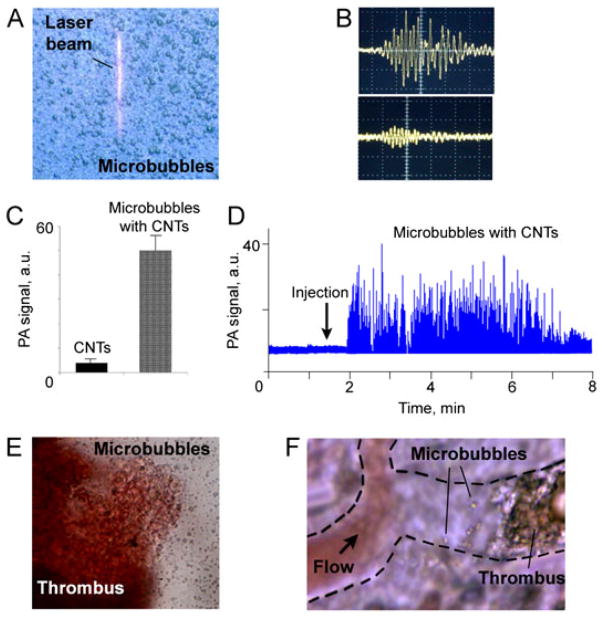
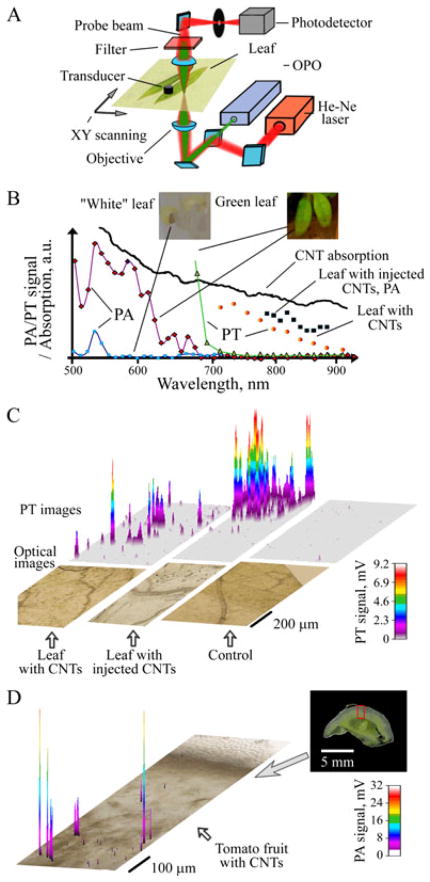
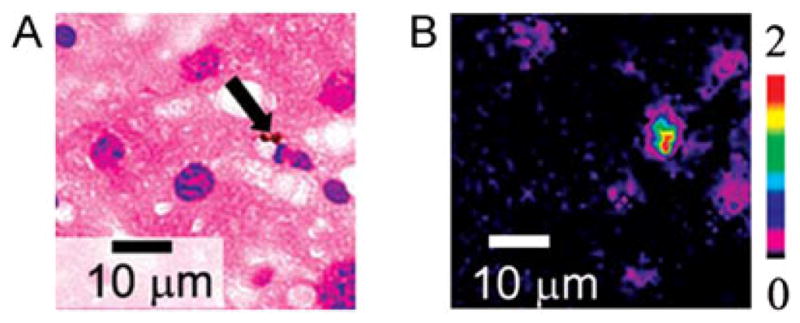
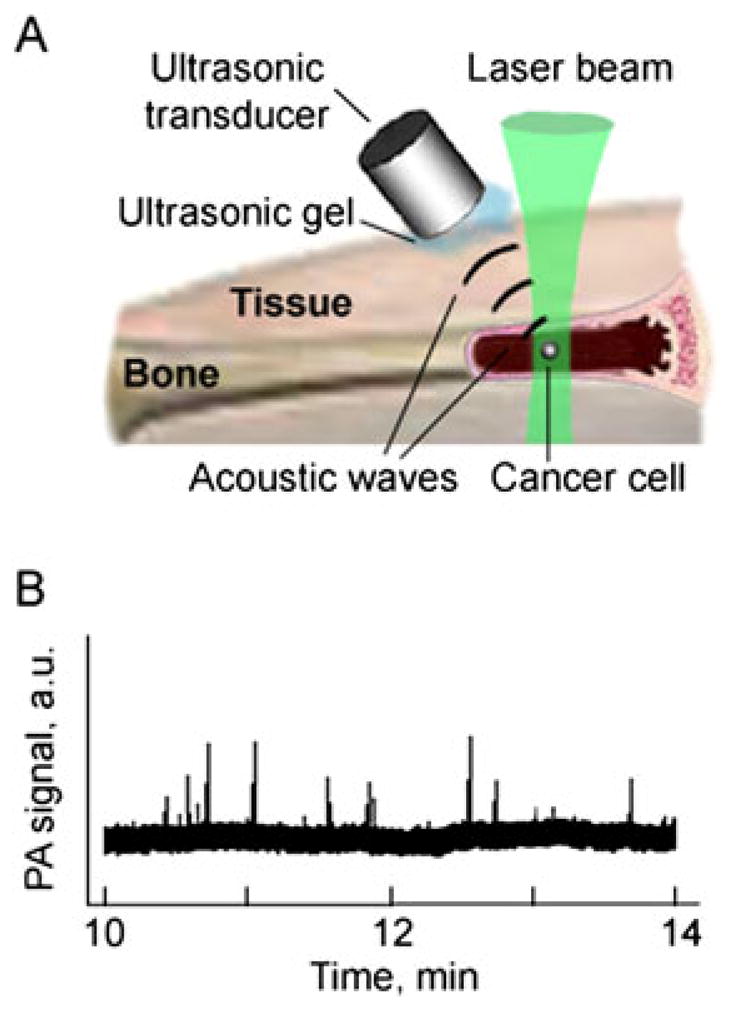
Various nanoparticles have raised significant interest over the past decades for their unique physical and optical properties and biological utilities. Here we summarize the vast applications of advanced nanoparticles with a focus on carbon nanotube (CNT)-based or CNT-catalyzed contrast agents for photoacoustic (PA) imaging, cytometry and theranostics applications based on the photothermal (PT) effect. We briefly review the safety and potential toxicity of the PA/PT contrast nanoagents, while showing how the physical properties as well as multiple biological coatings change their toxicity profiles and contrasts. We provide general guidelines needed for the validation of a new molecular imaging agent in living subjects, and exemplify these guidelines with single-walled CNTs targeted to α(v) β(3) , an integrin associated with tumor angiogenesis, and golden carbon nanotubes targeted to LYVE-1, endothelial lymphatic receptors. An extensive review of the potential applications of advanced contrast agents is provided, including imaging of static targets such as tumor angiogenesis receptors, in vivo cytometry of dynamic targets such as circulating tumor cells and nanoparticles in blood, lymph, bones and plants, methods to enhance the PA and PT effects with transient and stationary bubble conjugates, PT/PA Raman imaging and multispectral histology. Finally, theranostic applications are reviewed, including the nanophotothermolysis of individual tumor cells and bacteria with clustered nanoparticles, nanothrombolysis of blood clots, detection and purging metastasis in sentinel lymph nodes, spectral hole burning and multiplex therapy with ultrasharp rainbow nanoparticles.


Figures

Figure 1
Figure 1
(A) Principle of nanodiagnostics and nanotherapeutics with self-assembled nanoclusters. (B–E) Examples of hybrid and clustered nanoparticles (NPs): (B) site-specific functionalization of DNA to tips of carbon nanotube (CNT); (C) DNA-guided clustering of gold-coated CNTs; (D) adenoviral vector with gold NPs clustered in capsid; and (E) Schematic of DNA-directed self-assembly of nanocomposites with multi-layers of gold NPs with multiplex, multicolor and multifunctional capabilities based on the target theranostics tasks. Reproduced with permission from Zharov et al. (22).
Figure 2
Figure 2
(A) Schematic of single-walled and multi-walled carbon nanotubes (SWNT and MWNT, respectively). (B) Absorption spectra of SWNTs and golden carbon nanotubes (GNTs), and photoacoustic (PA) spectra of GNTs. Lines represent normalized optical spectra (left vertical axis) of GNTs in water (red curve), SWNTs in water (black curve) and water only (green curve) and the dots represent normalized PA signal amplitude (blue dots, right axis) of GNTs in water. The concentration of the SWNTs is ~35 times higher than that of GNTs; hence, 85- to 100-fold enhanced NIR contrast is achieved by the hybrid GNTs. Reproduced with permission from Kim et al. (9). (C) Optical absorption spectrum of SWNT-RGD (black curve) and indocyanine green-enhanced SWNT-RGD (SWNT-ICG-RGD, green curve). The optical absorbance spectrum of plain SWNT-RGD is relatively flat with slight gradual absorption decrease as the wavelength increase. However, by attaching a large number of ICG molecules to the SWNT surface, a 20-fold increase in optical absorption results at 780 nm. Reproduced with permission from de la Zerda et al. (7).
Figure 3
Figure 3
Photoacoustic (PA) detection of single-walled carbon nano-tube (SWNTs) in living mice. Mice were injected subcutaneously with SWNTs at increasing concentrations from 50 to 600 nM. An ultrasound image slice (gray) showing the skin level was overlaid on the PA image (green) which visualized the SWNT PA contrast. The dotted lines on the images illustrate the edges of each inclusion. The PA signal produced by 50 nM of SWNT is equal to the average PA background signal produced by tissues. Reproduced with permission from de la Zerda et al. (6).
Figure 4
Figure 4
Single-walled carbon nanotube arginine–glycine–aspartic acid (SWNT-RGD) tumor targeting in living mice. Ultrasound (gray) and photoacoustic (PA) (green) images of a vertical slice (white dotted line) through the tumors of mice injected with SWNT-RGD (right column) and control plain SWNTs (left column). Subtraction images were calculated as 4 h post-injection minus pre-injection to remove tissue background signal from the PA image. Mice injected with SWNT-RGD showed an averaged 7-fold PA signal increase in the tumor over mice injected with control untargeted SWNTs. The high PA signal in the mouse injected with plain SWNTs (indicated by the white arrow) is not seen in the subtraction image, suggesting that it is due to a large blood vessel and not SWNTs. Reproduced with permission from de la Zerda et al. (6).
Figure 5
Figure 5
Photoacoustic (PA) detection of single-walled carbon nanotube indocyanine green (SWNT-ICG) in living mice. Vertical slices of ultrasound images (gray) and PA images (green) of mice injected subcutaneously with SWNT-ICG-RGD at concentrations of 0.82–200 nM (dotted black line). The white dotted lines on the images illustrate the approximate edges of each inclusion. Quantitative analysis of the images estimated that 170 pM of SWNT-ICG-RGD gives the equivalent PA signal as the tissue background. Reproduced with permission from de la Zerda et al. (7).
Figure 6
Figure 6
In vivo photoacoustic/photothermal (PA/PT) molecular mapping of lymphatic vessels in mouse mesentery targeted by conjugated gold nanotubes (GNTs). (A) Schematic. (B) Fragment of mouse mesentery. (C) PA map of LYVE-1 receptor distribution. (D) Laser-induced localized (~10 μm in diameter) lymphatic wall damage around GNTs targeted to LYVE-1. Laser parameters: wavelength, 850 nm; pulse width, 8 ns; fluences, 35 mJ/cm2 (C) and 80 mJ/cm2 (D). Reproduced with permission from Kim et al. (9).
Figure 7
Figure 7
Photothermal nanotherapy of breast cancer cells (MDA-MB-231) double-labeled by gold nanotube-folates and FITC after their injection in the lymph node ex vivo. (A) Excision of lymph node from an intact mouse. The hollow black square indicates the ex vivo injection site of the tumor cells. (B) Fluorescent image (left) and photoacoustic (PA) signal (right) of targeted cancer cells within the lymph node at laser fluence of 20 mJ/cm2 at 850 nm. (C) Fluorescent image (left) and PA signal (right) as well as transmission microscopy image (middle) of the targeted cancer cells (same as B) within the lymph node after applying one laser pulse at 100 mJ/cm2 with laser beam diameter of 100 μm. The dashed circle in (C) indicates the location of a fluorescent signal before the one-purse application of the relatively high laser. Reproduced with permission from Kim et al. (9).
Figure 8
Figure 8
Photoacoustic (PA) signals in the mesenteric lymph vessels of rats. (A) Apoptotic lymphocytes labeled with GNSs (865 nm, 35 mJ/cm2). (B) Necrotic lymphocytes labeled with GNRs (639 nm, 25 mJ/cm2). (C) Live neutrophils labeled with carbon nanotubes absorbing at both wavelengths. Reproduced with permission from Galanzha et al. (5).
Figure 9
Figure 9
In vivo multiplex two-color photoacoustic (PA) detection of circulating tumor cells (CTCs). (A) The 10 nm magnetic NPs (MNPs) coated with amphiphilic triblock polymers, polyethylene glycol (PEG) and the amino-terminal fragment of urokinase plasminogen activator (ATF). The 12 × 98 nm GNTs coated with PEG and folic acid. (B) PA spectra of ~70 μm veins in mouse ear (open circles). Absorption spectra of the MNPs and GNTs (dashed curves) normalized to PA signals from CTC labeled with MNPs (black circle) and GNTs (open circle). (C) The size of the primary breast cancer xenografts at different time stages of tumor development. (D) Average rate of CTCs in mouse ear vein. Reproduced with permission from Galanzha et al. (8).
Figure 10
Figure 10
(A) Photoacoustic (PA) spectra of mouse skin alone and skin with blood vessels obtained with tunable optical parametric oscillator system. (B) Traces of PA signals from circulating carbon nanotubes (CNTs) in mouse ear blood microvessels after injection of 50 μL CNTs solution in phosphate- buffered saline (2.2 mg/ml). Laser parameters: wavelength 1064 nm, pulse rate 100 kHz, laser beam shape, 20 × 100 μm. Reproduced with permission from Nedosekin et al. (18).
Figure 11
Figure 11
(A) TEM images of an E. coli fragment before (left) and after (right) incubation with carbon nanotubes (CNTs). Arrows indicate CNT clusters within the bacteria wall structure. Scale bars represent 500 nm. (B) Normalized number of circulating E. coli in blood microvessels of mouse ear as a function of time post injection. Oscilloscope signals: photoacoustic signals from labeled E. coli in blood (top) and from blood alone (bottom). Amplitude/time scale: 200 mV/div/2 μs/div. Scale bar represents amplitude/time scale: 200 mV/div/2 μs/div, respectively. Laser parameters: wavelength 850 nm, laser fluence 50 mJ/cm2. Reproduced with permission from Zharov et al. (4).
Figure 12
Figure 12
Photothermal antimicrobial nanotherapy with carbon nanotube (CNT) clusters. (A) Schematic of CNT delivery to the infected site, their self- assembly at the bacterial surfaces or spontaneous bacterial adsorption to the large CNT clusters, and their NIR responsiveness to kill the bacteria. Cartoon shows live (green) and dead (red) bacteria. (B) Epi-fluorescence images of damaged E. coli adsorbed on clustered CNT after single-pulse laser exposure (1064 nm, 0.5 J/cm2, 12 ns). Scale bar is 5 μm. Reproduced with permission from Kim et al. (24).
Figure 13
Figure 13
(A) Optical image of 0.5–2 μm microbubbles with linear laser beam. (B) Typical linear photoacoustic signals from microbubbles with carbon nanotube (CNTs) (top) and surrounding contaminated medium (bottom). Amplitude/time scale: (top) 50 mV/div and 2 μs/div, (bottom) 10 mV/div and 2 μs/div. Laser parameters: wavelength 850 nm, energy fluence 20 mJ/cm2. (C) Nonlinear signals from CNTs in water suspension (left) and from microbubbles with CNTs (right) at similar concentration of CNTs. Laser parameters: wavelength 850 nm, energy fluence 100 mJ/cm2. (D) Clearance of circulating microbubbles with CNTs in mouse ear microvessels. (E) Optical image of thrombus with microbubbles in vitro. (F) In vivo animal model (rat mesentery) for study selective nanophotothrombolysis with nanoparticles and microbubbles.
Figure 14
Figure 14
Photothermal (PT) and photoacoustic (PA) detection of multi- walled carbon nanotube (CNTs) in tomato leaves. (A) Schematic of integrated PA/PT scanning cytometer. (B) Spectral PA and PT identification of CNTs using tomato leaves grown in darkness (white) and under light (green). (C) Two-dimensional PT maps (with three-dimensional simulation) of CNT distribution in tomato leaves compared with conventional optical images. Calibration model was constructed by injection of CNTs into leaf. (D) PA detection of CNTs in 1 mm-thick section of tomato fruit. Reproduced with permission from Khodakovskaya et al. (17).
Figure 15
Figure 15
Optical (left) and photothermal (PT) image (right) of mouse liver histological sample with carbon nanotube (CNTs). PT technique revealed many small (<0.3 μm) CNTs, which were invisible with conventional optical technique. The presence of a few large 1–2 μm CNT clusters (arrow) was used for verification of PT mapping. Laser parameters: wavelength 800 nm, pulse energy fluence 0.1 J/cm2. Reproduced with permission from Nedosekin et al. (16).
Figure 16
Figure 16
In vivo photoacoustic bone flow cytometry. (A) Schematics. (B) Noninvasive in vivo detection of circulating carbon nanotubes (CNTs) in mouse tibia.

References

    1. Zharov VP, Letokhov VS. Laser Optoacoustic Spectroscopy. Springer; New York: 1986.
    1. Wang L, editor. Photoacoustic Imaging and Spectroscopy. Taylor & Francis/CRC Press; Boca Raton, FL: 2009.
    1. Pan D, Caruthers SH, Chen J, Winter PM, SenPan A, Schmieder AH, Wickline SA, Lanza GM. Nanomedicine strategy for molecular targets with MRI and optical imaging. Future Med Chem. 2010;2:471– 490. - PMC - PubMed
    1. Zharov VP, Galanzha EI, Shashkov EV, Kim J-W, Khlebtsov NG, Tuchin VV. Photoacoustic flow cytometry: principle and application for real-time detection of circulating single nanoparticles, pathogens, and contrast dyes in vivo. J Biomed Opt. 2007;12:051503. - PubMed
    1. Galanzha EI, Shashkov EV, Tuchin VV, Zharov VP. In vivo multispectral, multiparameter, photoacoustic lymph flow cytometry with natural cell focusing, label-free detection and multicolor nanoparticle probes. Cytom A. 2008;73:884–894. - PMC - PubMed

Publication types

MeSH terms

LinkOut - more resources