

QT-interval duration and mortality rate: results from the Third National Health and Nutrition Examination Survey
- PMID: 22025428
- PMCID: PMC3339773
- DOI: 10.1001/archinternmed.2011.433
QT-interval duration and mortality rate: results from the Third National Health and Nutrition Examination Survey
Abstract
Background: Extreme prolongation or reduction of the QT interval predisposes patients to malignant ventricular arrhythmias and sudden cardiac death, but the association of variations in the QT interval within a reference range with mortality end points in the general population is unclear.
Methods: We included 7828 men and women from the Third National Health and Nutrition Examination Survey. Baseline QT interval was measured via standard 12-lead electrocardiographic readings. Mortality end points were assessed through December 31, 2006 (2291 deaths).
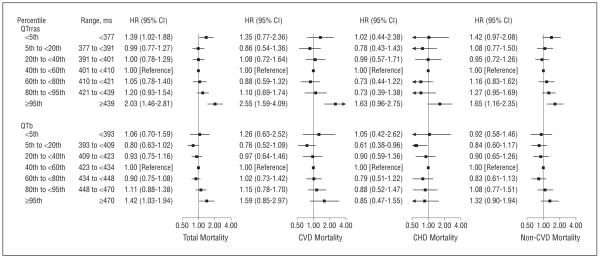
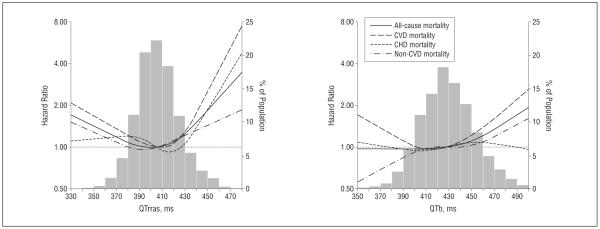
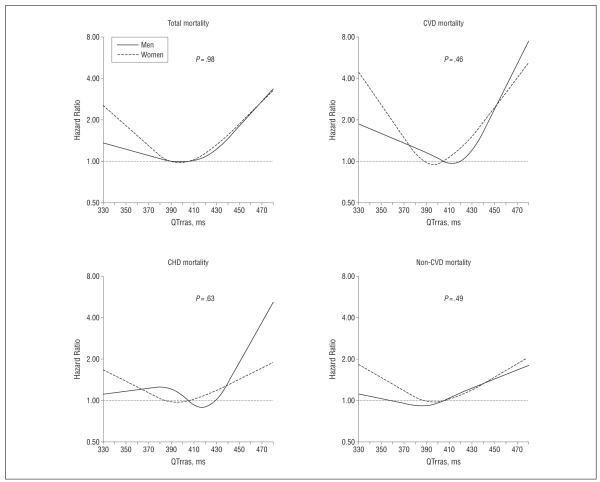
Results: After an average follow-up of 13.7 years, the association between QT interval and mortality end points was U-shaped. The multivariate-adjusted hazard ratios comparing participants at or above the 95th percentile of age-, sex-, race-, and R-R interval-corrected QT interval (≥439 milliseconds) with participants in the middle quintile (401 to <410 milliseconds) were 2.03 (95% confidence interval, 1.46-2.81) for total mortality, 2.55 (1.59-4.09) for mortality due to cardiovascular disease (CVD), 1.63 (0.96-2.75) for mortality due to coronary heart disease, and 1.65 (1.16-2.35) for non-CVD mortality. The corresponding hazard ratios comparing participants with a corrected QT interval below the fifth percentile (<377 milliseconds) with those in the middle quintile were 1.39 (95% confidence interval, 1.02-1.88) for total mortality, 1.35 (0.77-2.36) for CVD mortality, 1.02 (0.44-2.38) for coronary heart disease mortality, and 1.42 (0.97-2.08) for non-CVD mortality. Increased mortality also was observed with less extreme deviations of QT-interval duration. Similar, albeit weaker, associations also were observed with Bazett-corrected QT intervals.
Conclusion: Shortened and prolonged QT-interval durations, even within a reference range, are associated with increased mortality risk in the general population.
Figures
Comment in
-
QT interval and mortality: the long, the short, and the ugly. Comment on "QT interval duration and mortality rate".Arch Intern Med. 2011 Oct 24;171(19):1734-5. doi: 10.1001/archinternmed.2011.504. Arch Intern Med. 2011. PMID: 22025429 No abstract available.
References
-
- Priori SG, Schwartz PJ, Napolitano C, et al. Risk stratification in the long-QT syndrome. N Engl J Med. 2003;348(19):1866–1874. - PubMed
-
- Sauer AJ, Moss AJ, McNitt S, et al. Long QT syndrome in adults. J Am Coll Cardiol. 2007;49(3):329–337. - PubMed
-
- fGaita F, Giustetto C, Bianchi F, et al. Short QT syndrome: a familial cause of sudden death. Circulation. 2003;108(8):965–970. - PubMed
-
- Gussak I, Brugada P, Brugada J, et al. Idiopathic short QT interval: a new clinical syndrome. Cardiology. 2000;94(2):99–102. - PubMed
-
- Schimpf R, Borggrefe M, Wolpert C. Clinical and molecular genetics of the short QT syndrome. Curr Opin Cardiol. 2008;23(3):192–198. - PubMed
Publication types
MeSH terms
Grants and funding
LinkOut - more resources
Full Text Sources
Medical
