. 2011 Dec 30;286(52):44855-68.
doi: 10.1074/jbc.M111.275529. Epub 2011 Oct 24.

Role of pro-oncogenic protein disulfide isomerase (PDI) family member anterior gradient 2 (AGR2) in the control of endoplasmic reticulum homeostasis

Affiliations

Role of pro-oncogenic protein disulfide isomerase (PDI) family member anterior gradient 2 (AGR2) in the control of endoplasmic reticulum homeostasis

Arisa Higa et al. J Biol Chem. .

Abstract

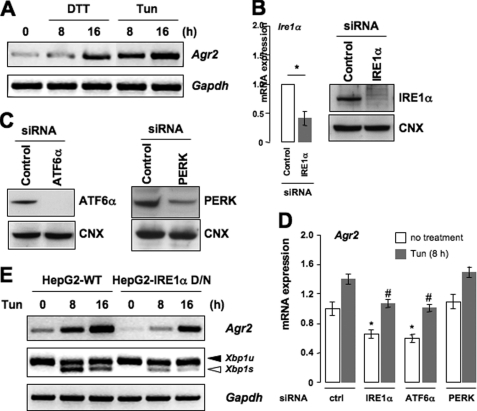
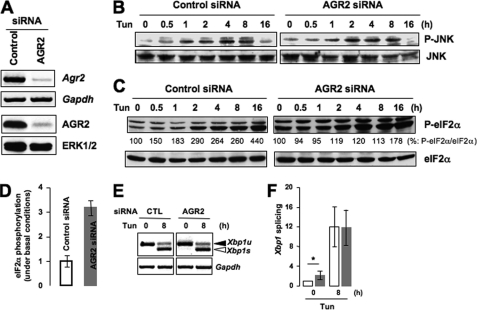
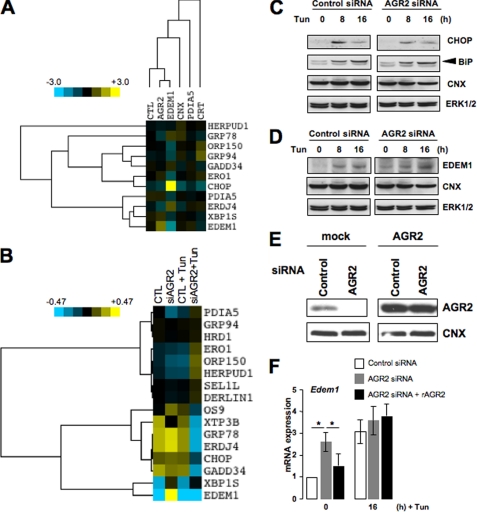
The protein-disulfide isomerase (PDI) family member anterior gradient 2 (AGR2) is reportedly overexpressed in numerous cancers and plays a role in cancer development. However, to date the molecular functions of AGR2 remain to be characterized. Herein we have identified AGR2 as bound to newly synthesized cargo proteins using a proteomics analysis of endoplasmic reticulum (ER) membrane-bound ribosomes. Nascent protein chains that translocate into the ER associate with specific ER luminal proteins, which in turn ensures proper folding and posttranslational modifications. Using both imaging and biochemical approaches, we confirmed that AGR2 localizes to the lumen of the ER and indirectly associates with ER membrane-bound ribosomes through nascent protein chains. We showed that AGR2 expression is controlled by the unfolded protein response and is in turn is involved in the maintenance of ER homeostasis. Remarkably, we have demonstrated that siRNA-mediated knockdown of AGR2 significantly alters the expression of components of the ER-associated degradation machinery and reduces the ability of cells to cope with acute ER stress, properties that might be relevant to the role of AGR2 in cancer development.


Figures

FIGURE 1.
FIGURE 1.
Schematic representation of the ribosome-associated ER proteins enrichment strategy. A, electron micrograph of dog pancreatic rough ER microsomes purified from dog pancreas. Scale bar, corresponds to 1 μm. B, representation of the experimental scheme. Rough ER microsomes were solubilized with 1.5% CHAPS for 30 min on ice. The resulting lysates were centrifuged, and the protein content in the supernatant was spun through a 1.5 m sucrose cushion for 3 h at 95,000 rpm in a Beckman TLA100.2 rotor. RAP pellets were then collected.
FIGURE 2.
FIGURE 2.
Isolation of RAPs. A, representative Coomassie Blue-stained gel of rough ER microsome fractions: total solubilized rough ER microsomes (TOT; 50 μg) and RAP (corresponding to 500 μg of starting rough ER microsomes). Each individually stained band was excised and trypsin-digested prior to mass spectrometry sequencing. Results are representative of four independent experiments. B, distribution of functional groups of proteins identified in the RAP fractions. C, distribution of functional groups of proteins identified in the ribosome-associated membrane protein (RAMP) fraction. D, validation of the proteins found in the RAP fraction. Total solubilized rough ER (RER) microsomes (TOT; 20 μg) and the RAP fraction (from 200 μg of total solubilized rough ER microsomes) were resolved by SDS-PAGE and transferred to nitrocellulose prior to immunoblotting analysis using the indicated antibodies. Ib, immunoblot. Results are representative of three independent experiments.
FIGURE 3.
FIGURE 3.
Computational analysis of the proteomics data. A, network representation of the proteins identified in the proteomics analysis. The functional network, built using the STRING program suite, contains 143 nodes and 4733 edges. White nodes, ribosomal; orange nodes, ER translocation and folding; yellow nodes, translation; green nodes, export (light) and cargo (dark). B, POPP analysis of the RAPs of uncharacterized function against the 213 proteins found in our proteomics approach. C, cluster analysis of the RAPs of uncharacterized functions into six functional families based on their POPP homology profiles.
FIGURE 4.
FIGURE 4.
Characterization of AGR2. A, amino acid sequence alignment of AGR2 with two members of the PDI superfamily, ERp19 and ERp29 (GenBankTM accession numbers: NM006408, NM015913, and NM006817, respectively). An amino acid sequence comparison was performed using the ClustalW algorithm. Vertical alignments between the sequences for identical and similar amino acids are highlighted in different colors. Gaps were introduced as represented by dots to optimize the alignment. Green boxes indicate the signal peptide, red boxes indicate thioredoxin-like domains, and yellow boxes indicate putative ER retrieval motifs. B, comparison of a predicted model for the AGR2 structure version (Protein Data Bank code 1SEN, the structure determined for ERp19). C, superposition of the hydropobicity surface on the predicted structure for AGR2 (ribbon). D, validation by immunoblotting analysis of AGR2 in the RAP fraction as described in C. E, evaluation of the presence of AGR2 in ribosomal pellet in conditions where the ribosome pulldown was performed under control conditions (Ctl), in the presence of 5 mm EDTA (middle blots), or following treatment with puromycin (Puro). Ib, immunoblot. RER, rough ER. The scheme shows the experimental strategy used. F, immunofluorescence analysis of endogenous AGR2 protein by confocal microscopy. HuH6 cells were costained using anti-AGR2 (middle panels) and anti-CNX antibodies (left panels). Merged images are shown on the right panels.
FIGURE 5.
FIGURE 5.
AGR2 expression is controlled by the UPR in mammalian cells. A, HeLa cells were treated with one of two ER stressors, Tun (5 μg/ml) or DTT (1 mm), for 8 or 16 h. Total mRNA was isolated, and Agr2 mRNA expression was analyzed by semiquantitative RT-PCR using the specific primers against Agr2 and Gapdh. B, IRE1α expression was silenced in HeLa cells for 48 h by siRNA. RT-PCR (left graph) and immunoblotting (right panels) analyses were carried out using the primers against Ire1α and Gapdh or antibodies against IRE1α or CNX. Results represent the mean ± S.D. from three independent experiments (*, p < 0.05, as compared with control siRNA transfection). C, HeLa cells were transfected with ATF6α or PERK siRNA. At 48 h post-siRNA transfection, cells were lysed in radioimmune precipitation assay buffer and analyzed by immunoblotting using anti-ATF6α or PERK antibodies. CNX expression was used as a loading control. D, HepG2 cells were transfected with control siRNAs (ctrl) or siRNA targeting of IRE1α, ATF6α, or PERK followed by treatment with Tun for 8 h or left untreated. RT-PCR analysis was performed as described in A. Three independent experiments were performed, and the results are presented as means ± S.D. (*, p < 0.05, as compared with control; #, p < 0.03, as compared with control siRNA transfection upon Tun treatment). E, wild-type HepG2 (HepG2-WT) or HepG2 cells expressing a dominant negative IRE1α (HepG2-IRE1α D/N) were treated with Tun for 8 or 16 h. Agr2 mRNA expression and splicing of Xbp1 mRNA were analyzed by semiquantitative RT-PCR. The results are representative of three independent experiments.
FIGURE 6.
FIGURE 6.
AGR2 silencing moderately affects ER stress signals under basal conditions. A, AGR2 expression was knocked down in HeLa cells for 72 h. RT-PCR analysis of Agr2 mRNA expression was performed using mRNAs isolated from control or AGR2 siRNA-transfected cells (upper panels). Gapdh mRNA expression was used as internal control. Protein extracts from AGR2-transfected cells were prepared and analyzed by immunoblotting (lower panels). ERK1/2 was used as a protein loading control. B, HeLa cells were transfected with control or AGR2 siRNA for 72 h and treated with Tun for the indicated periods of time. Cell lysates were prepared and analyzed by immunoblotting using antibodies against JNK and phosphorylated JNK (P-JNK). C, HeLa cells were transfected and treated as described in B. Cells were lysed and analyzed by immunoblotting using anti-eIF2α and P-eIF2α antibodies. Bands were quantified by densitometry; the ratio of P-eIF2α to eIF2α is shown below each band. D, quantification of the levels of eIF2α phosphorylation in control and AGR2-knocked down cells under the non-stress conditions shown in C. E, HeLa cells were transfected as described in B and treated with Tun for 8 h. Total RNA was isolated, and the splicing of Xbp-1 mRNA was analyzed by semiquantitative RT-PCR. Gapdh was used as an internal control (CTL). F, quantification of Xbp1 splicing obtained from three independent experiments as represented in E. Results represent means ± S.D. (*, p < 0.05, as compared with control).
FIGURE 7.
FIGURE 7.
AGR2 silencing slightly affects ER stress signals under basal conditions. A, heat map representation of the expression of IRE1α (Xbp1s, Edem1 and ERdj4), ATF6α (BiP/Grp78, Ero1lb, Grp94, Orp150, and Pdia5) or PERK (Chop and Gadd34) target genes and components of ERAD (Herpud1) in HeLa cells silenced for AGR2, EDEM1, calnexin, PDIA5, or calreticulin under basal conditions. B, heat map representation of the expression of IRE1α (Xbp1s, Edem1 and ERdj4), ATF6α (BiP/Grp78, Ero1lb, Grp94, Orp150 and Pdia5), or PERK (Chop and Gadd34) target genes and components of ERAD (Derlin1, Hrd1, Os-9, Sel1l, Herpud1, and Xtp3-b) in HeLa non-transfected (CTL, control) and silenced for AGR2 upon basal or Tun-induced stress conditions. C, HeLa cells were transfected with control or AGR2 siRNA for 72 h followed by treatment with Tun for 8 or 16 h. Cells were lysed and immunoblotted with anti-CHOP or anti-BiP antibodies. Anti-CNX or ERK1/2 antibodies were used as loading controls. D, AGR2 was silenced in HeLa cells, and Tun was added to the cells as described in B. Cell lysates were analyzed by immunoblotting using antibodies against EDEM1, CNX, or ERK1/2. E, HeLa cells were transfected with control or AGR2 siRNA. After 72 h of siRNA transfection, cells were further transfected with pcDNA6-AGR2 plasmid. Twenty-four hours later, cells were lysed, and the lysates were immunoblotted using anti-AGR2 and anti-CNX antibodies. F, HeLa cells were transfected with AGR2 siRNA and AGR2 cDNA as described in D. Total RNAs from the cells were used for semiquantitative RT-PCR using the primers for Edem1. Quantification of the amplified PCR products was done using three independent experiments (*, p < 0.05, as compared with AGR2 siRNA-transfected cells).
FIGURE 8.
FIGURE 8.
AGR2 silencing alters the ability of cells to process terminally misfolded proteins. A, 72 h after control or AGR2 siRNA transfection, HeLa cells were treated with Tun (5 μg/ml) or DTT (0.1 mm) for 36 h. Cell viability was measured using the sulforhodamine B assay system. Results represent the mean ± S.D. (*, p < 0.05, **, p < 0.01 as compared with control cells upon ER stressor treatment). B, HeLa cells were transfected with a control siRNA (ctrl) or one targeting AGR2 for 48 h followed by transient transfection with a plasmid expressing α1AT-NHK or α1AT-WT. Expression of AGR2 or α1AT (NHK or WT) was analyzed by immunoblotting, and CNX was used as a loading control. C, control HeLa cells or HeLa cells silenced for AGR2 (siAGR2) were transiently transfected with a plasmid to express α1AT-NHK or α1AT-WT and then pulse-labeled for 15 min with [35S]methionine/cysteine followed by chase for the period indicated as described under “Experimental Procedures.” Shown are the autoradiograms of newly synthesized [35S]methionine-radiolabeled intracellular and secreted α1AT-WT and α1AT-NHK immunoprecipitated from HeLa cell lysates from cells subjected to siRNA with irrelevant siRNA (siCTL or GL2) or against AGR2 (siAGR2). D, HeLa cells were transfected with AGR2 or EDEM1 siRNA or co-transfected with AGR2 and EDEM1 siRNAs. At 72 h after siRNA transfection, cells were further transfected with α1AT-NHK. The next day, cells were metabolically labeled with [35S]methionine for 15 min. Labeled cells were then chased for 1, 2, 4, 6, and 8 h. Intracellular NHK was immunoprecipitated with anti-α1AT antibodies and resolved by SDS-PAGE. The percentage of newly synthesized α1-AT proteins at 6 h in silenced cells was calculated by densitometry and compared with that of control cells. Results represent means ± S.D. of three independent experiments (*, p < 0.05; #, p < 0.02, as compared with control).
FIGURE 9.
FIGURE 9.
AGR2 silencing sensitizes cells to ER stress-induced autophagy. A, AGR2 and/or EDEM1 was silenced by siRNA in HeLa cells for 72 h. Cell lysates were prepared and analyzed by immunoblotting using anti-LC3 antibodies. CNX antibodies were used as a protein loading control. B, quantification of the ratio of LC3-II relative to total LC3 (LC3-I + LC3-II) was performed on the immunoblots shown in A by densitometry. Data are represented as means ± S.D. of three independent experiments. Asterisks indicate statistical significance (*, p < 0.03, compared with control siRNA transfection). C, HeLa cells stably expressing a control shRNA (shCTL) or targeting AGR2 were subjected to tunicamycin treatment (5 μg/ml) for 8 h in the presence or absence of 20 mm NH4Cl. Lysates were analyzed by immunoblotting with antibodies to LC3 and CNX.
FIGURE 10.
FIGURE 10.
Schematic representation of AGR2 function in the ER. The functional AGR2 network was built using the STRING program suite and drawn using the Cytoscape program. Pink nodes represent the translocation machinery, green nodes stand for the membrane traffic component of the network, blue nodes correspond to the UPR machinery, and orange nodes correspond to the ERQC/folding machinery. White nodes are also indicated but were not found in the ARG2 functional network in our study. A standard cargo is presented in blue and AGR2 in yellow. The STING-based interactions are shown in gray. The regulatory interactions found in our study are presented in green (positive) or red (negative). A connection between AGR2 and the autophagic machinery is also shown (black dotted line). Finally, the interaction of AGR2 with cargo molecules is shown in blue. The ER membrane is symbolized in gray.

Similar articles

Cited by

References

    1. Chevet E., Cameron P. H., Pelletier M. F., Thomas D. Y., Bergeron J. J. (2001) Curr. Opin. Struct. Biol. 11, 120–124 - PubMed
    1. Mori K. (2000) Cell 101, 451–454 - PubMed
    1. Kleizen B., Braakman I. (2004) Curr. Opin. Cell Biol. 16, 343–349 - PubMed
    1. Ruddock L. W., Molinari M. (2006) J. Cell Sci. 119, 4373–4380 - PubMed
    1. Määttänen P., Gehring K., Bergeron J. J., Thomas D. Y. (2010) Semin. Cell Dev. Biol. 21, 500–511 - PubMed

Publication types