

Structural basis for partial redundancy in a class of transcription factors, the LIM homeodomain proteins, in neural cell type specification
- PMID: 22025611
- PMCID: PMC3234805
- DOI: 10.1074/jbc.M111.248559
Structural basis for partial redundancy in a class of transcription factors, the LIM homeodomain proteins, in neural cell type specification
Abstract
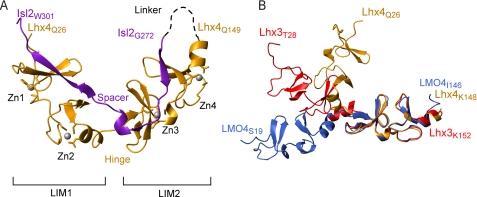
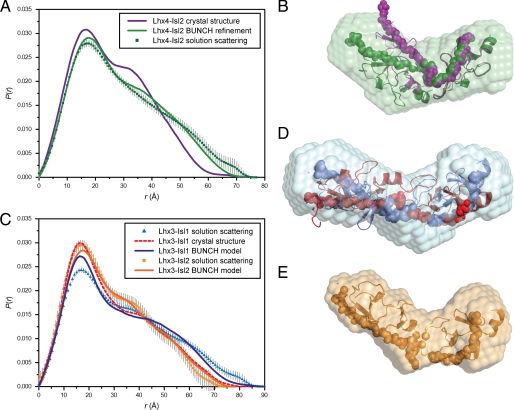
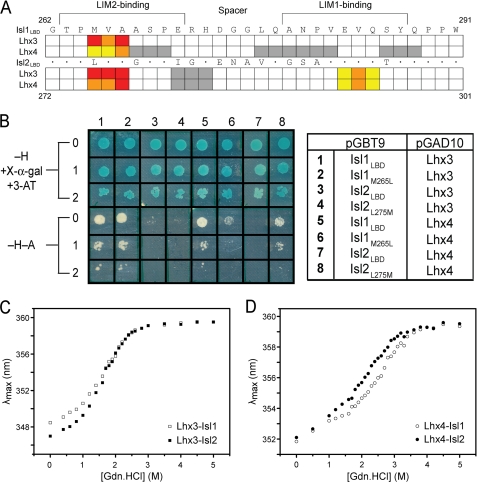
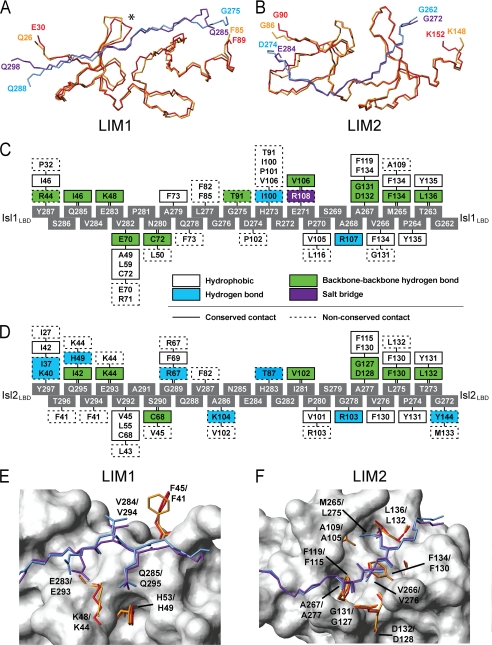
Combinations of LIM homeodomain proteins form a transcriptional "LIM code" to direct the specification of neural cell types. Two paralogous pairs of LIM homeodomain proteins, LIM homeobox protein 3/4 (Lhx3/Lhx4) and Islet-1/2 (Isl1/Isl2), are expressed in developing ventral motor neurons. Lhx3 and Isl1 interact within a well characterized transcriptional complex that triggers motor neuron development, but it was not known whether Lhx4 and Isl2 could participate in equivalent complexes. We have identified an Lhx3-binding domain (LBD) in Isl2 based on sequence homology with the Isl1(LBD) and show that both Isl2(LBD) and Isl1(LBD) can bind each of Lhx3 and Lhx4. X-ray crystal- and small-angle x-ray scattering-derived solution structures of an Lhx4·Isl2 complex exhibit many similarities with that of Lhx3·Isl1; however, structural differences supported by mutagenic studies reveal differences in the mechanisms of binding. Differences in binding have implications for the mode of exchange of protein partners in transcriptional complexes and indicate a divergence in functions of Lhx3/4 and Isl1/2. The formation of weaker Lhx·Isl complexes would likely be masked by the availability of the other Lhx·Isl complexes in postmitotic motor neurons.
Figures
Similar articles
-
Solution structure of the LIM-homeodomain transcription factor complex Lhx3/Ldb1 and the effects of a pituitary mutation on key Lhx3 interactions.PLoS One. 2012;7(7):e40719. doi: 10.1371/journal.pone.0040719. Epub 2012 Jul 25. PLoS One. 2012. PMID: 22848397 Free PMC article.
-
Implementing the LIM code: the structural basis for cell type-specific assembly of LIM-homeodomain complexes.EMBO J. 2008 Jul 23;27(14):2018-29. doi: 10.1038/emboj.2008.123. Epub 2008 Jun 26. EMBO J. 2008. PMID: 18583962 Free PMC article.
-
A structural basis for the regulation of the LIM-homeodomain protein islet 1 (Isl1) by intra- and intermolecular interactions.J Biol Chem. 2013 Jul 26;288(30):21924-35. doi: 10.1074/jbc.M113.478586. Epub 2013 Jun 9. J Biol Chem. 2013. PMID: 23750000 Free PMC article.
-
LIM Homeodomain (LIM-HD) Genes and Their Co-Regulators in Developing Reproductive System and Disorders of Sex Development.Sex Dev. 2022;16(2-3):147-161. doi: 10.1159/000518323. Epub 2021 Sep 10. Sex Dev. 2022. PMID: 34518474 Review.
-
Decoding the LIM development code.Trans Am Clin Climatol Assoc. 2003;114:179-89. Trans Am Clin Climatol Assoc. 2003. PMID: 12813919 Free PMC article. Review.
Cited by
-
A patient with combined pituitary hormone deficiency and osteogenesis imperfecta associated with mutations in LHX4 and COL1A2.J Adv Res. 2019 Oct 21;21:121-127. doi: 10.1016/j.jare.2019.10.006. eCollection 2020 Jan. J Adv Res. 2019. PMID: 32071780 Free PMC article.
-
Solution structure of the LIM-homeodomain transcription factor complex Lhx3/Ldb1 and the effects of a pituitary mutation on key Lhx3 interactions.PLoS One. 2012;7(7):e40719. doi: 10.1371/journal.pone.0040719. Epub 2012 Jul 25. PLoS One. 2012. PMID: 22848397 Free PMC article.
-
Contribution of DEAF1 structural domains to the interaction with the breast cancer oncogene LMO4.PLoS One. 2012;7(6):e39218. doi: 10.1371/journal.pone.0039218. Epub 2012 Jun 19. PLoS One. 2012. PMID: 22723967 Free PMC article.
-
Disparate binding kinetics by an intrinsically disordered domain enables temporal regulation of transcriptional complex formation.Proc Natl Acad Sci U S A. 2018 May 1;115(18):4643-4648. doi: 10.1073/pnas.1714646115. Epub 2018 Apr 16. Proc Natl Acad Sci U S A. 2018. PMID: 29666277 Free PMC article.
-
Selecting optimal combinations of transcription factors to promote axon regeneration: Why mechanisms matter.Neurosci Lett. 2017 Jun 23;652:64-73. doi: 10.1016/j.neulet.2016.12.032. Epub 2016 Dec 23. Neurosci Lett. 2017. PMID: 28025113 Free PMC article. Review.
References
-
- Matthews J. M., Bhati M., Lehtomaki E., Mansfield R. E., Cubeddu L., Mackay J. P. (2009) Curr. Pharm. Des. 15, 3681–3696 - PubMed
-
- Bachy I., Failli V., Rétaux S. (2002) Neuroreport 13, A23–A27 - PubMed
-
- Tsuchida T., Ensini M., Morton S. B., Baldassare M., Edlund T., Jessell T. M., Pfaff S. L. (1994) Cell 79, 957–970 - PubMed
-
- Failli V., Rogard M., Mattei M. G., Vernier P., Rétaux S. (2000) Genomics 64, 307–317 - PubMed
-
- Sharma K., Sheng H. Z., Lettieri K., Li H., Karavanov A., Potter S., Westphal H., Pfaff S. L. (1998) Cell 95, 817–828 - PubMed
Publication types
MeSH terms
Substances
LinkOut - more resources
Full Text Sources
Other Literature Sources
Molecular Biology Databases
Research Materials
