. 2011 Nov 1;108(44):17905-9.
doi: 10.1073/pnas.1101766108. Epub 2011 Oct 24.

Increase of extreme events in a warming world

Affiliations

Increase of extreme events in a warming world

Stefan Rahmstorf et al. Proc Natl Acad Sci U S A. .

Erratum in

  • Proc Natl Acad Sci U S A. 2012 Mar 20;109(12):4708

Abstract

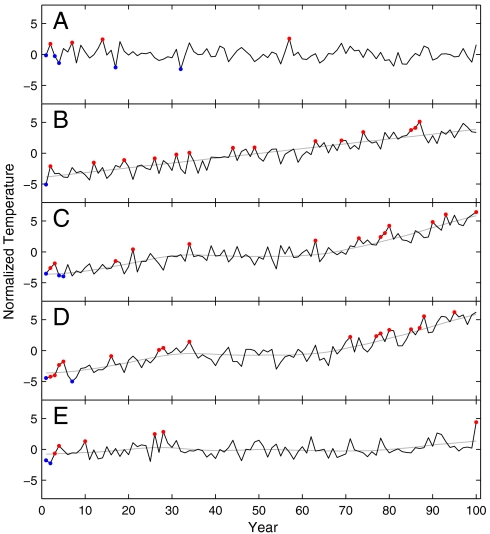
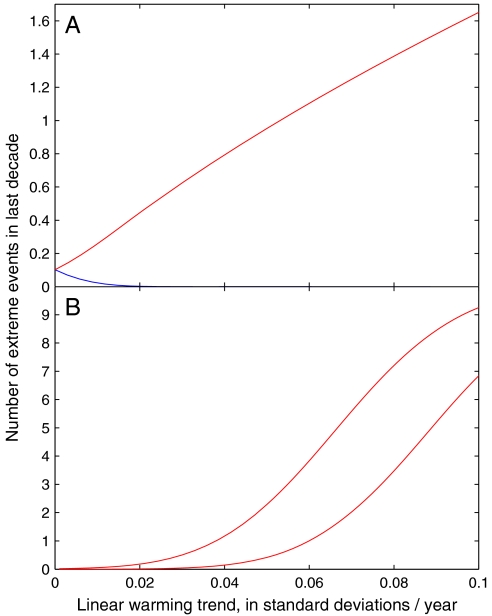
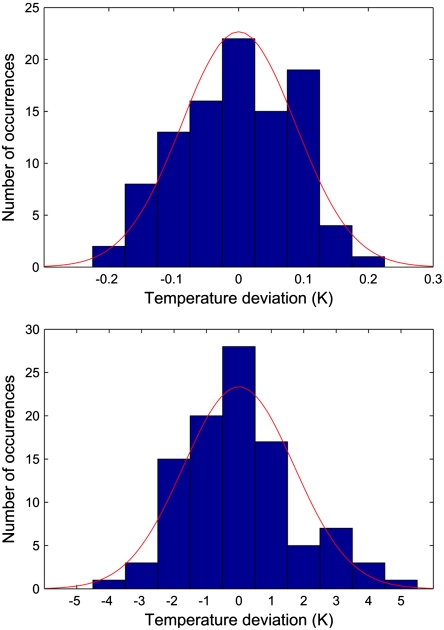
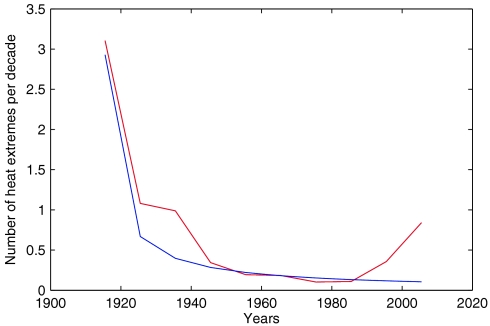
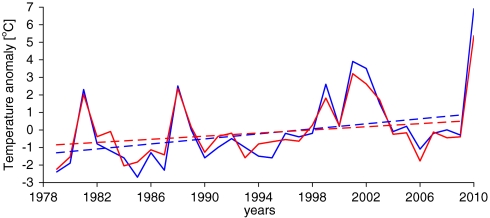
We develop a theoretical approach to quantify the effect of long-term trends on the expected number of extremes in generic time series, using analytical solutions and Monte Carlo simulations. We apply our method to study the effect of warming trends on heat records. We find that the number of record-breaking events increases approximately in proportion to the ratio of warming trend to short-term standard deviation. Short-term variability thus decreases the number of heat extremes, whereas a climatic warming increases it. For extremes exceeding a predefined threshold, the dependence on the warming trend is highly nonlinear. We further find that the sum of warm plus cold extremes increases with any climate change, whether warming or cooling. We estimate that climatic warming has increased the number of new global-mean temperature records expected in the last decade from 0.1 to 2.8. For July temperature in Moscow, we estimate that the local warming trend has increased the number of records expected in the past decade fivefold, which implies an approximate 80% probability that the 2010 July heat record would not have occurred without climate warming.


Conflict of interest statement

The authors declare no conflict of interest.

Figures

Fig. 1.
Fig. 1.
Examples of 100-y time series of nondimensional temperature, with unprecedented hot and cold extremes marked in red and blue. (A) Uncorrelated Gaussian noise of unit standard deviation. (B) Gaussian noise with added linear trend of 0.078/y (shown in gray). (C) Gaussian noise with nonlinear trend line added (smooth of global GISS data shown in gray). (D) The actual GISS annual global temperature data for 1911–2010, with its nonlinear trend line. (E) July temperature at Moscow station for 1911–2010, with its nonlinear trend line. Note that in all panels temperatures are normalized with the standard deviation of their short-term variability (see Methods), hence the climatic warming at Moscow appears to be relatively small, although the linear warming is 1.8 °C in Moscow and 0.7 °C in the global GISS data over the last 100 y.
Fig. 2.
Fig. 2.
Analytical solutions for the expected number of cold (blue) and warm (red) extremes in the last 10 y of 100-y time series shown as a function of the ratio of linear trend to standard deviation of the series. (A) Unprecedented extremes. (B) Extremes exceeding fixed threshold temperatures—in this case, 3 and 4 standard deviations from the mean. The analytical solutions shown are identical to the results of the Monte Carlo simulations.
Fig. 3.
Fig. 3.
Histogram of the deviations of temperatures of the past 100 y from the nonlinear climate trend lines shown in Fig. 1 D and E, together with Gaussian distributions with the same variance and integral. (Upper) Global annual mean temperatures from NASA GISS, with a standard deviation of 0.088 ºC. (Lower) July mean temperature at Moscow station, with a standard deviation of 1.71 ºC.
Fig. 4.
Fig. 4.
Expected number of unprecedented July heat extremes in Moscow for the past 10 decades. Red is the expectation based on Monte Carlo simulations using the observed climate trend shown in Fig. 1E. Blue is the number expected in a stationary climate (1/n law). Warming in the 1920s and 1930s and again in the past two decades increases the expectation of extremes during those decades.
Fig. 5.
Fig. 5.
Comparison of temperature anomalies from remote sensing systems surface data (red; ref. 15) over the Moscow region (35ºE–40ºE, 54ºN–58ºN) versus Moscow station data (blue; ref. 21). The solid lines show the average July value for each year, whereas the dashed lines show the linear trend of these data for 1979–2009 (i.e., excluding the record 2010 value). The satellite data have a trend of 0.45 ºC per decade for 1979–2009, as compared to 0.72 ºC per decade for the Moscow station data.

References

    1. World Meteorological Organization. Weather Extremes in a Changing Climate: Hindsight on Foresight. Geneva: World Meteorological Organization; 2010. Current extreme weather events. Available at http://www.wmo.int/pages/mediacentre/news/extremeweathersequence_2010_en.... Accessed October 5, 2011.
    1. World Meteorological Organization. Weather Extremes in a Changing Climate: Hindsight on Foresight. Geneva: World Meteorological Organization; 2011. WMO publication no. 1075.
    1. Hansen J, Ruedi R, Sato M, Lo K. Global surface temperature change. Rev Geophys. 2010;48:RG4004.
    1. Solomon S, et al., editors. Intergovernmental Panel on Climate Change. The Fourth Assessment Report of the Intergovernmental Panel on Climate Change. Cambridge, UK: Cambridge Univ Press; 2007.
    1. Krug J. Records in a changing world. J Stat Mech. 2007;7:1–13.

LinkOut - more resources