. 2011 Nov 8;108(45):E1070-9.
doi: 10.1073/pnas.1106454108. Epub 2011 Oct 24.

Regulable neural progenitor-specific Tsc1 loss yields giant cells with organellar dysfunction in a model of tuberous sclerosis complex

Affiliations

Regulable neural progenitor-specific Tsc1 loss yields giant cells with organellar dysfunction in a model of tuberous sclerosis complex

June Goto et al. Proc Natl Acad Sci U S A. .

Abstract

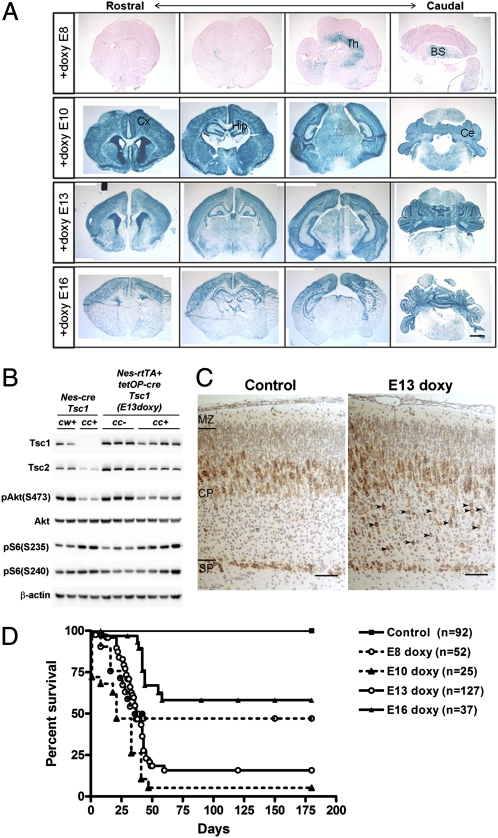
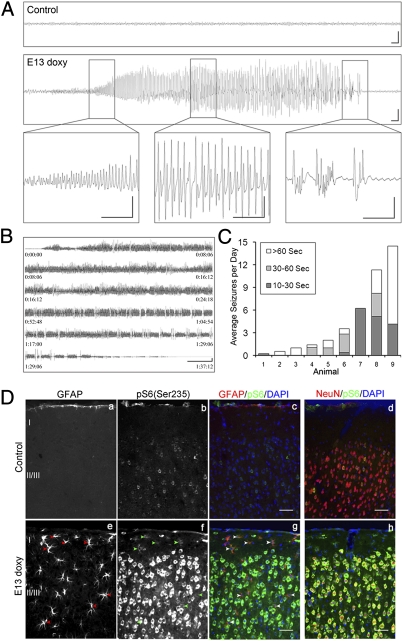
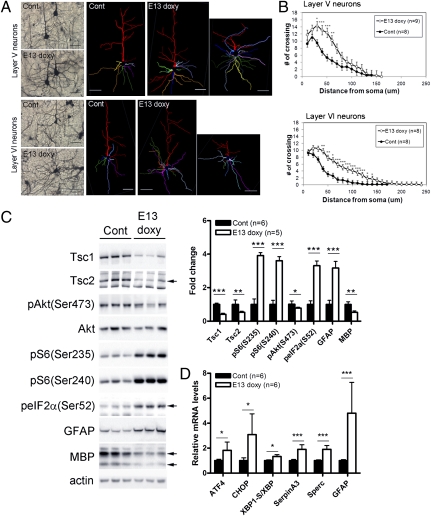
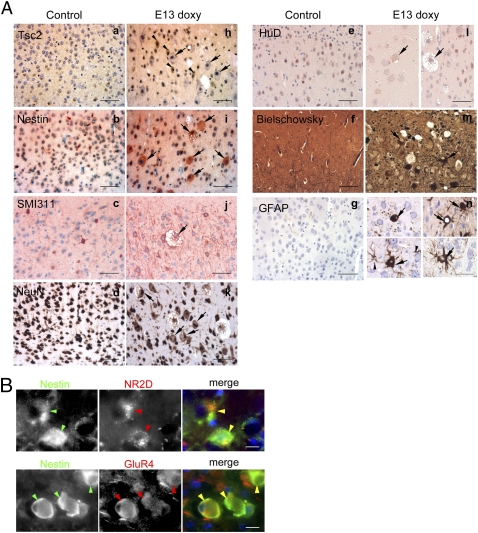
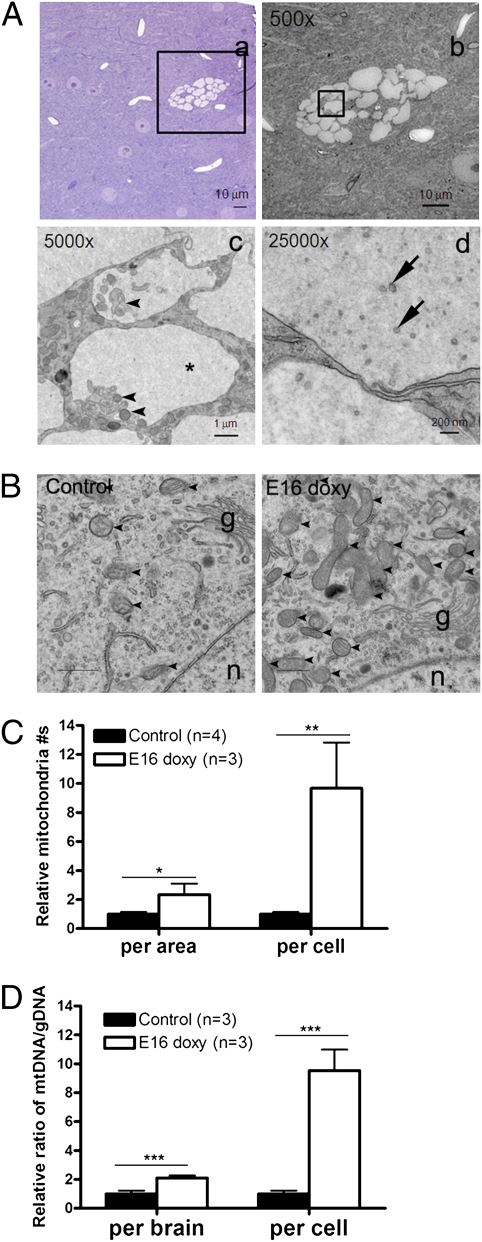
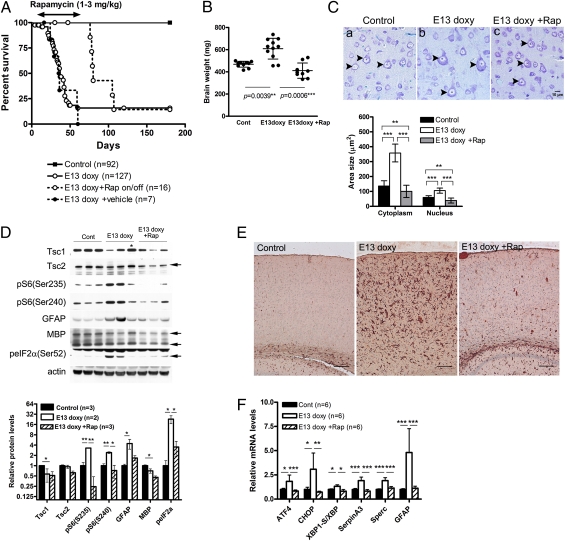
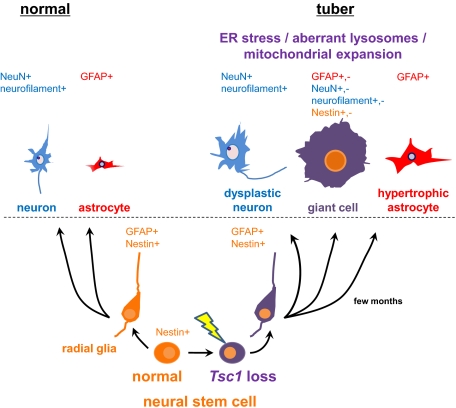
Tuberous sclerosis complex (TSC) is a multiorgan genetic disease in which brain involvement causes epilepsy, intellectual disability, and autism. The hallmark pathological finding in TSC is the cerebral cortical tuber and its unique constituent, giant cells. However, an animal model that replicates giant cells has not yet been described. Here, we report that mosaic induction of Tsc1 loss in neural progenitor cells in Tsc1(cc) Nestin-rtTA(+) TetOp-cre(+) embryos by doxycycline leads to multiple neurological symptoms, including severe epilepsy and premature death. Strikingly, Tsc1-null neural progenitor cells develop into highly enlarged giant cells with enlarged vacuoles. We found that the vacuolated giant cells had multiple signs of organelle dysfunction, including markedly increased mitochondria, aberrant lysosomes, and elevated cellular stress. We found similar vacuolated giant cells in human tuber specimens. Postnatal rapamycin treatment completely reversed these phenotypes and rescued the mutants from epilepsy and premature death, despite prenatal onset of Tsc1 loss and mTOR complex 1 activation in the developing brain. This TSC brain model provides insights into the pathogenesis and organelle dysfunction of giant cells, as well as epilepsy control in patients with TSC.


Conflict of interest statement

The authors declare no conflict of interest.

Figures

Fig. 1.
Fig. 1.
Mosaic loss of Tsc1 in doxycycline-treated Tsc1cc Nes-rtTA+ TetOp-cre+ mice. (A) LacZ staining using rosa26 β-gal allele of P8-P10 Tsc1cc Nes-rtTA+ TetOp-cre+ brains treated with doxycycline on different embryonic days (E8–E16). A mosaic pattern of recombination is seen with E13 and E16 doxycycline administration, with recombination mainly in the hippocampus, upper cortex, and cerebellum. (B) Immunoblot analysis of P0 brain lysates from Tsc1cc Nes-rtTA+ TetOp-cre+ mice (c/c+, n = 4) and littermate controls (c/c, n = 3) treated with doxycycline at E13 (Right) and from Tsc1cc Nestin-cre+ mice (c/c+, n = 2) and littermate controls (c/w+, n = 2) (Left). Tsc1cc Nes-rtTA+ TetOp-cre+ (E13 doxy) mice showed partial loss of Tsc1 protein and moderate activation of the mTOR pathway in comparison to Tsc1cc Nestin-cre+ mutants. (C) IHC with pS6(Ser235) antibody in P0 brains shows evidence of mTORC1 activation in cortical plate cells (arrowheads) in Tsc1cc Nes-rtTA+ TetOp-cre+ (E13-doxy) mice. (D) Survival of Tsc1cc Nes-rtTA+ TetOp-cre+ mice according to day of embryonic doxycycline administration. The control group includes 77 Tsc1cc Nes-rtTA+ TetOp-cre mice that received doxycycline and 15 Tsc1cc Nes-rtTA+ TetOp-cre+ mice that did not receive doxycycline. BS, brainstem; Ce, cerebellum; Cx, cortex; Hip, hippocampus; Th, thalamus. (Scale bars: A, 1 mm; C, 100 μm.)
Fig. 2.
Fig. 2.
Spontaneous seizures with neuronal and glial mTORC1 activation in Tsc1cc Nes-rtTA+ TetOp-cre+ (E13 doxy) mice. (A) Cortical epidural EEG monitoring of P30 control mice (Upper) and Tsc1cc Nes-rtTA+ TetOp-cre+ (E13 doxy) mice (Lower), the latter during a seizure. (Insets) Onset of seizure activity (Left), progression to a period of sharp wave trains (Center), and then reduction with a period of postictal slowing (Right). (Scale bars: 1 s, 500 μV.) (B) Series of near-constant epileptiform discharges recorded in a mutant, leading to the death of this mouse. (Scale bar: 30 s, 500 μV.) (C) Average number of seizures per day in nine mutant mice. Shading indicates the duration of the observed seizures in untreated (columns 3, 5, 6, and 9) and vehicle-treated (columns 1, 2, 4, 7, and 8) mutants. (D) Immunofluorescence analysis of cortical sections of P55 mutant mice shows an increase in pS6(Ser235) (bd and fh) in both neurons (d and h) and astrocytes (a, c, e, and g, arrowheads). (Scale bars: 50 μm.)
Fig. 3.
Fig. 3.
Dendritic abnormalities, ER stress, and inflammatory response seen in the brains of Tsc1cc Nes-rtTA+ TetOp-cre+ (E13 doxy) mice. (A and B) Dendritic morphology of pyramidal neurons in layers V and VI of mutant mice at P30 by Golgi staining and Sholl analysis. (C) Immunoblotting showing a decrease in Tsc1 and Tsc2 expression with mTORC1 activation, a stress response (increased phospho-eIF2αSer52), astrogliosis (increased GFAP), and hypomyelination (MBP) in P30 mutants (n = 3). (D) Real-time qPCR analysis using hippocampal RNAs of six symptomatic mutants at P30. Data have been normalized to 36b4 mRNA levels. Levels of the ER stress markers (ATF4 and CHOP) and inflammatory response genes seen in cortical tubers (SerpinA3 and Sperc) are significantly increased in the mutants. Cont, control. *P < 0.05; **P < 0.01; ***P < 0.001. (Scale bars: A, 50 μm.)
Fig. 4.
Fig. 4.
Brain pathology and vacuolated giant cells in Tsc1cc Nes-rtTA+ TetOP-cre+ (E13 doxy) mice. (A) Vacuolated neurons in layers I–III and giant cells in a radial column (arrowheads) in the cortex (Right). (B) Cell size analysis. The diameter (d) of pS6+ cortical cells was measured (n = 70 cells, 2 animals). Note that in controls, 99% of pS6+ cells have a diameter <20 μm, whereas the converse is true in mutants. The distribution of cell size according to the number of vacuoles is shown at the bottom. (C) Location of giant cells (d > 40 μm) in a mutant brain. Red indicates clusters of giant cells with vacuoles, and blue indicates clusters of nonvacuolated giant cells. (D) Brain sections of control (Left) and Tsc1cc Nes-rtTA+ TetOp-cre+ (E13 doxy) mutant (Right) mice at the age of 6 mo show enlarged balloon-like giant cells (white arrows), and giant cells with intracellular vacuoles (black arrows) by IHC using pS6(Ser235). (E) Giant cells with (black arrows) and without (white arrow) vacuoles found in cortical tubers of pediatric patients with TSC by IHC using pS6(Ser235) antibody. (Scale bars: A, 100 μm; D and E, 50 μm.)
Fig. 5.
Fig. 5.
Expression studies showing the giant cells seen in Tsc1cc Nes-rtTA+ TetOp-cre+ (E13 doxy) mutant mice express multiple neural markers. (A) Brain sections of Tsc1cc Nes-rtTA+ TetOp-cre+ (E13 doxy) mutant at the age of 6 mo show enlarged giant cells (black arrows) that lack expression of Tsc2 (a and h), express high levels of nestin (b and i) and neurofilaments (SMI311; c and j), weakly express NeuN (d and k), more weakly express HuD compared with normal neurons (e and l), and also contain neurofibrillary tangles (Bielschowsky stain; f and m). Markedly enlarged GFAP+ giant cells are also seen (black arrows, g and n). Note that neurons expressing Tsc2 are of normal size (black arrowheads in h). (Scale bars: 50 μm.) (B) Colocalization of nestin and NR2D (Upper) and nestin and GluR4 (Lower) in giant cells. (Scale bars: 20 μm.)
Fig. 6.
Fig. 6.
Ultrastructural analysis of giant cells in Tsc1cc Nes-rtTA+ TetOp-cre+ (E16 doxy) mice. (A) Highly vacuolated neurons seen in bright field (a) and electron (bd) micrographs. Insets in a and b identify the area enlarged in the next panel. Single-walled vacuoles filled with protein-like material (asterisk), portion of ER membranes and endosomal membranes (arrowheads), and small vesicles (arrows) are shown. (B) Increased mitochondria in giant cells with small vacuoles in Tsc1cc Nes-rtTA+ TetOp-cre+ (E16 doxy) giant cells. Mitochondria (arrowheads), the Golgi apparatus (g), and the nucleus (n) are shown. (C) Relative mitochondrial density (per area) and contents (per cell) are increased in giant cells in mutants, calculated by considering the 4.1-fold increase in mutant cell volume. (D) Quantitative analysis of brain mtDNA content in Tsc1cc Nes-rtTA+ TetOp-cre+ (E16 doxy) mice by real-time PCR, using four mtDNA primer sets in comparison to gDNA primer sets. The relative mtDNA content per Tsc1-null cell was calculated considering the 13% level of recombination in Tsc1 seen in these same samples by MLPA. *P < 0.05; **P < 0.01; ***P < 0.001. Scale bars are indicated in A, ad.
Fig. 7.
Fig. 7.
Postnatal rapamycin treatment rescues survival and improves multiple aspects of the phenotype of Tsc1cc Nes-rtTA+ TetOp-cre+ (E13 doxy) mice. (A) Survival curves of Tsc1cc Nes-rtTA+ TetOp-cre+ (E13 doxy) mice treated with rapamycin from P8–P55 and then taken off the drug (Rap on/off). The survival of treated mutant mice at P55 is significantly different from that of both untreated (P = 0.0032) and vehicle-treated (P = 0.0022) mutants. After removal of rapamycin, the mutants started to die within 2 wk. (B) Brain weight of P30 animals. (C) (Upper) Cortical layer V pyramidal neurons (arrowheads) at P42. (Scale bar: 10 μm.) (Lower) Graph of neuronal area and neuronal nucleus area of pS6+ cortical cells in control, mutant, and rapamycin-treated mutant mice. (D) Immunoblot analysis of rapamycin-treated mutants at P30 shows a reduction in mTORC1 activation markers, phospho-eIF2α, and GFAP levels. Only MBP levels remain low. An asterisk denotes a mutant with low or undetectable levels of Tsc1 recombination. Quantitation of immunoblot band intensity is shown at the bottom. Cont, control. (E) IHC staining for GFAP on cortical sections from control, E13 doxy mutant, and E13 doxy mutant treated with rapamycin, all at P30 (n = 3). (Scale bars: 100 μm.) (F) Real-time qPCR analysis using hippocampal RNA of rapamycin-treated mutant (n = 6) at P30 shows that ATF4, CHOP, SerpinA3, Sperc, and GFAP levels returned to normal in response to rapamycin. Rapamycin was given i.p. for 3 d each week at a dose of 1 mg/kg for P8–P20 and 3 mg/kg for P21–P55. *P < 0.05; **P < 0.01; ***P < 0.001.
Fig. P1.
Fig. P1.
Mouse model of TSC has been engineered in which Tsc1 is lost in subsets of neural progenitor cells, leading to formation of three aberrant cell types, including giant cells at 4–6 mo of age. These giant cells have endoplasmic reticulum (ER) stress, aberrant lysosomes, and mitochondrial expansion.

References

    1. Jozwiak J, Jozwiak S, Wlodarski P. Possible mechanisms of disease development in tuberous sclerosis. Lancet Oncol. 2008;9(1):73–79. - PubMed
    1. Kwiatkowski DJ, Thiele EA, Whittemore VH, editors. Tuberous Sclerosis Complex: Genes, Clinical Features, and Therapeutics. Germany: Wiley–VCH, Weinheim; 2010. p. 432.
    1. Thiele EA. Managing epilepsy in tuberous sclerosis complex. J Child Neurol. 2004;19:680–686. - PubMed
    1. Holmes GL, Stafstrom CE, Tuberous Sclerosis Study Group Tuberous sclerosis complex and epilepsy: Recent developments and future challenges. Epilepsia. 2007;48:617–630. - PubMed
    1. Doherty C, Goh S, Young Poussaint T, Erdag N, Thiele EA. Prognostic significance of tuber count and location in tuberous sclerosis complex. J Child Neurol. 2005;20:837–841. - PubMed

Publication types