. 2011 Oct 25:7:66.
doi: 10.1186/1746-6148-7-66.

Generating social network data using partially described networks: an example informing avian influenza control in the British poultry industry

Affiliations

Generating social network data using partially described networks: an example informing avian influenza control in the British poultry industry

Sema Nickbakhsh et al. BMC Vet Res. .

Abstract

Background: Targeted sampling can capture the characteristics of more vulnerable sectors of a population, but may bias the picture of population level disease risk. When sampling network data, an incomplete description of the population may arise leading to biased estimates of between-host connectivity. Avian influenza (AI) control planning in Great Britain (GB) provides one example where network data for the poultry industry (the Poultry Network Database or PND), targeted large premises and is consequently demographically biased. Exposing the effect of such biases on the geographical distribution of network properties could help target future poultry network data collection exercises. These data will be important for informing the control of potential future disease outbreaks.

Results: The PND was used to compute between-farm association frequencies, assuming that farms sharing the same slaughterhouse or catching company, or through integration, are potentially epidemiologically linked. The fitted statistical models were extrapolated to the Great Britain Poultry Register (GBPR); this dataset is more representative of the poultry industry but lacks network information. This comparison showed how systematic biases in the demographic characterisation of a network, resulting from targeted sampling procedures, can bias the derived picture of between-host connectivity within the network.

Conclusions: With particular reference to the predictive modeling of AI in GB, we find significantly different connectivity patterns across GB when network estimates incorporate the more demographically representative information provided by the GBPR; this has not been accounted for by previous epidemiological analyses. We recommend ranking geographical regions, based on relative confidence in extrapolated estimates, for prioritising further data collection. Evaluating whether and how the between-farm association frequencies impact on the risk of between-farm transmission will be the focus of future work.


Figures
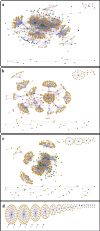
Figure 1
Figure 1
Components of the British poultry industry network. Full contact network between poultry farms, slaughterhouses (SHs), catching companies (CCs) and integrated companies (ICs) (a), and network components partitioned into associations between farms and SHs (b), farms and CCs (c) and between farms within ICs (d), using farms for which complete contact information was known (n = 662). Orange = farm, red = SH, black = largest SH, green = CC, blue = IC.
Figure 2
Figure 2
Extrapolating between-farm association frequency from the Poultry Network Database to the Great Britain Poultry Register. County-level average probabilities of small, medium and large between-farm association frequencies, as observed in the Poultry Network Database (n = 662) (a), and as predicted following extrapolation to the Great Britain Poultry Register (GBPR) (n = 3009) using fitted statistical models (farms known to be associated with the large slaughterhouse represent only ~3% of GBPR farms and therefore cannot be seen from this figure) (b). Pie sizes are proportional to the county-level number of farms for the respective datasets.
Figure 3
Figure 3
Predicted regional-level between-farm association frequency extrapolated to farms recorded in the Great Britain Poultry Register. Regional average probabilities of (a) large versus medium and (b) large versus small between-farm association frequencies (blue circles), following extrapolation of network information to the Great Britain Poultry Register (n = 3009 farms). Error bars represent 95% confidence intervals generated from 1000 stochastic simulations of randomly assigning each farm to a small, medium or large between-farm association frequency group. Black triangles represent proportions of farms within these categories observed from the Poultry Network Database (n = 662 farms). (c) Geographical clustering of the regional predicted probabilities represented by their corresponding colours (note: Scotland and Wales were considered distinct from the other regions). W = Wales; S = Scotland; L = Greater London; WM = West Midlands, SW = South West, EM = East Midlands, NE = North East, E = East, Y = Yorkshire, NW = North West and SE = South East of England.
Figure 4
Figure 4
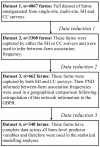
Reducing the Poultry Network Database into data subsets. SH = slaughterhouse; CC = catching company; PND = Poultry Network Database; GBPR = Great Britain Poultry Register.
Figure 5
Figure 5
Distribution of between-farm association frequency and analysis scenarios. A comparison between large (1079-1623 associations, n = 147 farms) and small/medium (1-879 associations, n = 515 farms) between-farm association frequencies formed scenario 1 analyses, and a comparison between medium (301-897 associations, n = 141 farms) and small (1-299 associations, n = 374 farms) between-farm association frequencies formed scenario 2 analyses. Note: this figure refers to the analysis prior to the removal of records with missing data (i.e. n = 662 farms) and was not qualitatively different following this data reduction.

References

    1. Stumpf MP, Wiuf C, May R. Subnets of scale-free networks are not scale-free: Sampling properties of networks. Natl Acad Sci USA. 2005;102:4221–4224. doi: 10.1073/pnas.0501179102. - DOI - PMC - PubMed
    1. Ghani AC, Donnelly CA, Garnett GP. Sampling biases and missing data in explorations of sexual partner networks for the spread of sexually transmitted diseases. Stat Med. 1998;17:2079–2097. doi: 10.1002/(SICI)1097-0258(19980930)17:18<2079::AID-SIM902>3.0.CO;2-H. - DOI - PubMed
    1. Stumpf MPH, Wiuf C. Incomplete and noisy network data as a percolation process. Journal of the Royal Society Interface. 2010;7:1411–1419. doi: 10.1098/rsif.2010.0044. - DOI - PMC - PubMed
    1. Watts CH, May RM. The influence of concurrent partnerships on the dynamics of HIV/AIDS. Math Biosci. 1992;108:89–104. doi: 10.1016/0025-5564(92)90006-I. - DOI - PubMed
    1. Tildesley MJ, Savill NJ, Shaw DJ, Deardon R, Brooks SP, Woolhouse ME, Grenfell BT, Keeling MJ. Optimal reactive vaccination strategies for a foot-and-mouth outbreak in the UK. Nature. 2006;440:83–86. doi: 10.1038/nature04324. - DOI - PubMed

Publication types

MeSH terms