. 2012 Feb;1822(2):185-95.
doi: 10.1016/j.bbadis.2011.10.008. Epub 2011 Oct 17.

Berberine protects against high fat diet-induced dysfunction in muscle mitochondria by inducing SIRT1-dependent mitochondrial biogenesis

Affiliations

Berberine protects against high fat diet-induced dysfunction in muscle mitochondria by inducing SIRT1-dependent mitochondrial biogenesis

Ana P Gomes et al. Biochim Biophys Acta. 2012 Feb.

Abstract

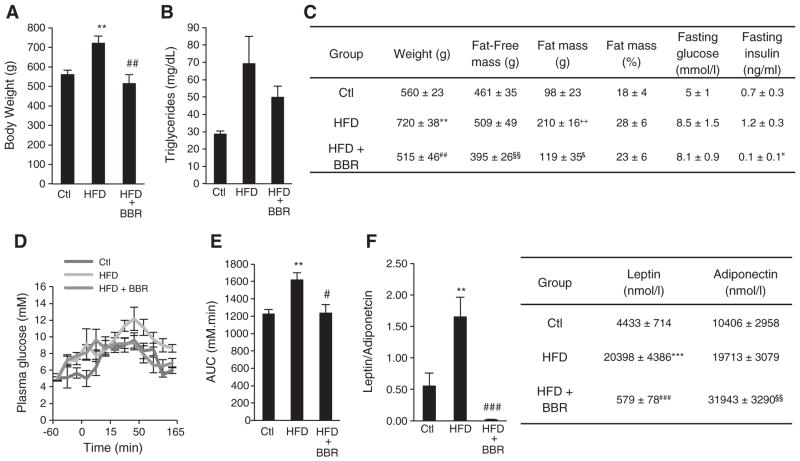
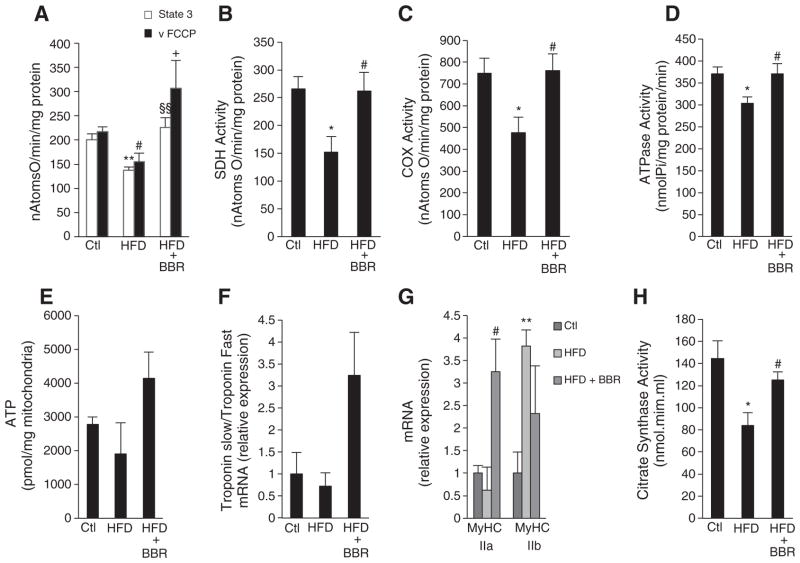
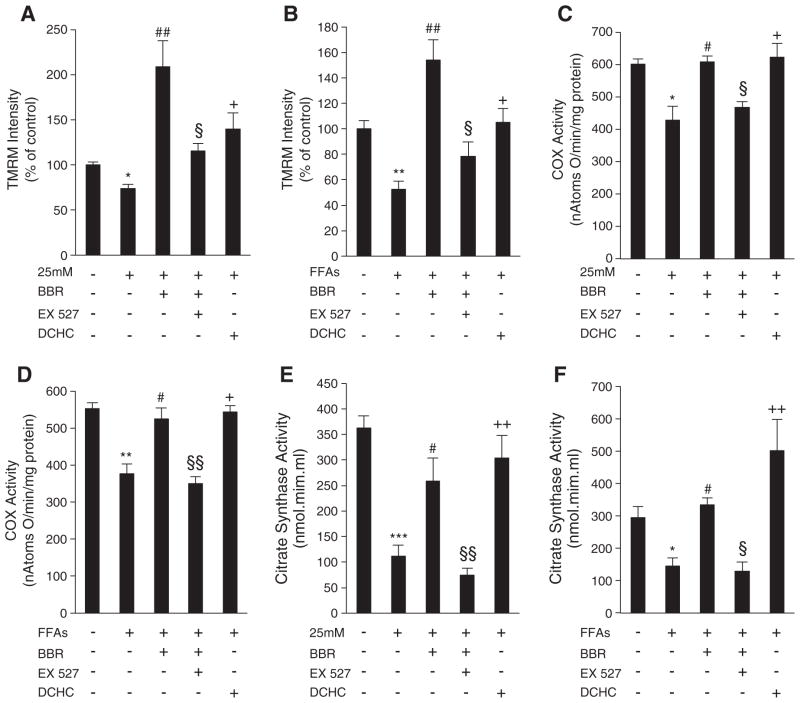
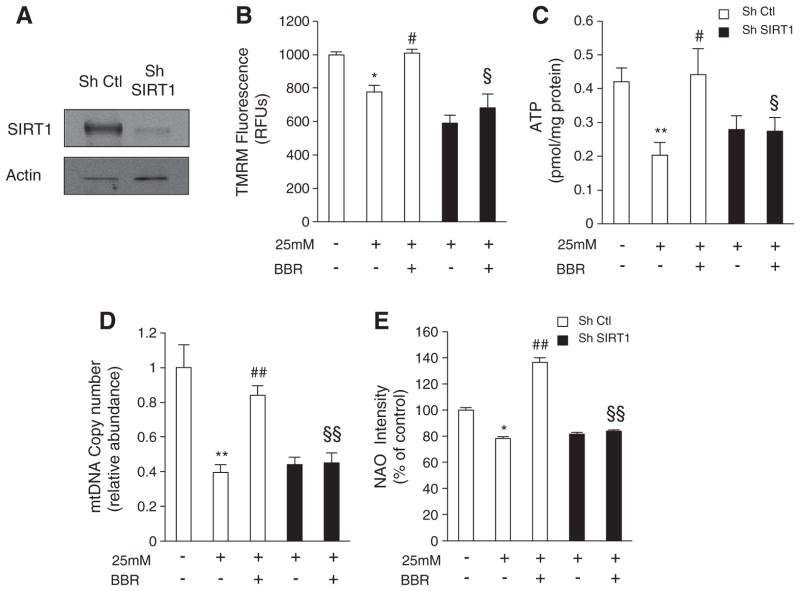
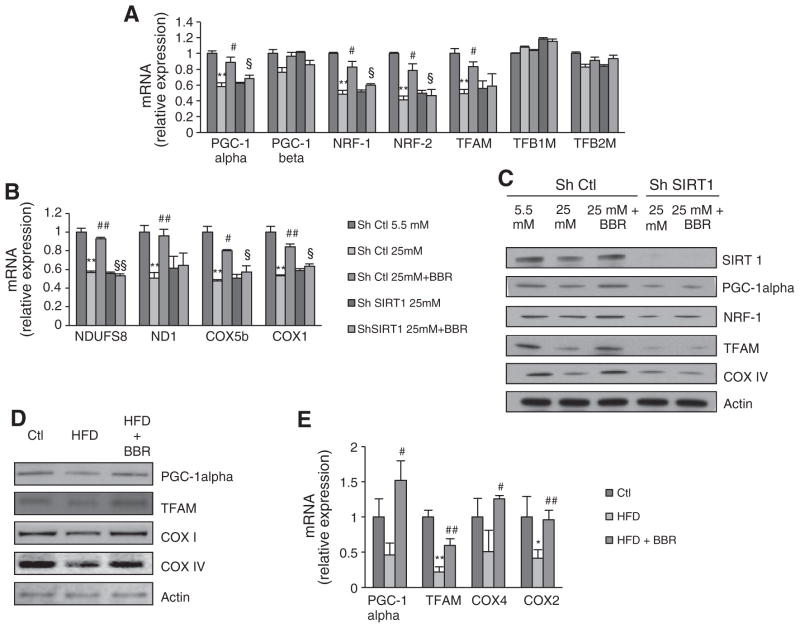
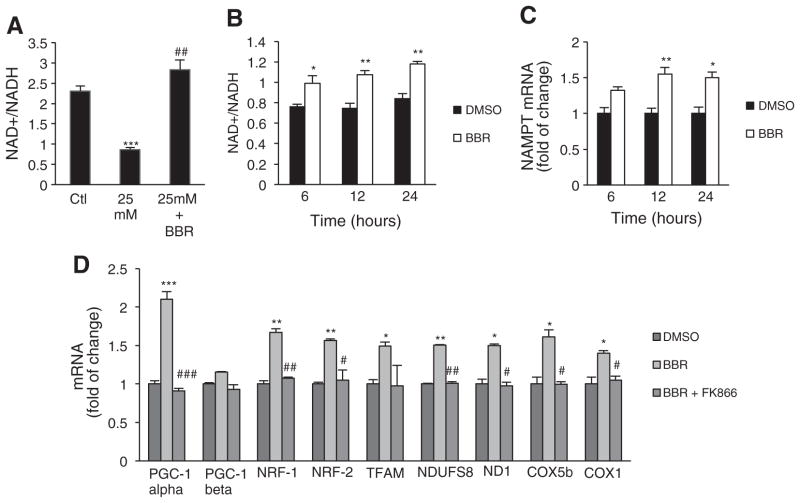
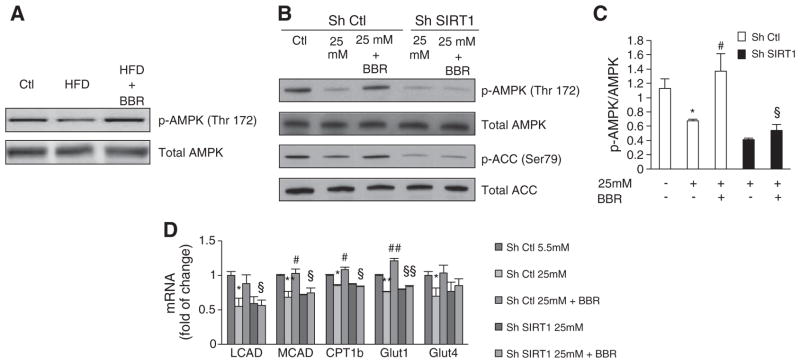
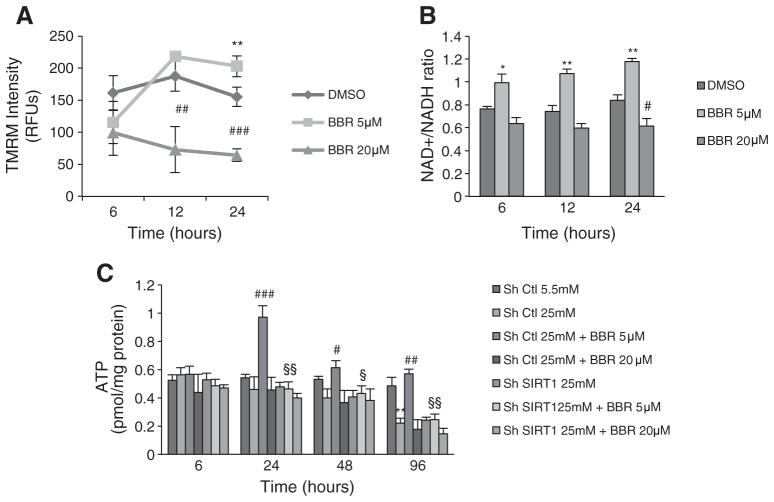
Berberine (BBR) has recently been shown to improve insulin sensitivity in rodent models of insulin resistance. Although this effect was explained partly through an observed activation of AMP-activated protein kinase (AMPK), the upstream and downstream mediators of this phenotype were not explored. Here, we show that BBR supplementation reverts mitochondrial dysfunction induced by High Fat Diet (HFD) and hyperglycemia in skeletal muscle, in part due to an increase in mitochondrial biogenesis. Furthermore, we observe that the prevention of mitochondrial dysfunction by BBR, the increase in mitochondrial biogenesis, as well as BBR-induced AMPK activation, are blocked in cells in which SIRT1 has been knocked-down. Taken together, these data reveal an important role for SIRT1 and mitochondrial biogenesis in the preventive effects of BBR on diet-induced insulin resistance.


Conflict of interest statement

Conflict of interest declaration

D.A.S. is a consultant for Sirtris, a GSK company developing sirtuin-based medicines. No other potential conflicts of interest were reported.

Figures

Fig. 1
Fig. 1
Berberine protects from obesity and obesity-induced impairment in glucose homeostasis in Sprague–Dawley Rats. (A) Body Weight of rats fed with Chow diet (Ctl), High Fat Diet (HFD) and High Fat Diet supplemented with BBR (HFD+BRR) (n=5 experiments **p<0.01 versus Ctl, ## p<0.01 versus HFD). (B) Triglycerides content expressed in mg/dL in skeletal muscle of rats fed with Chow diet (Ctl), High Fat Diet (HFD) and High Fat Diet supplemented with BBR (HFD+BRR) (n=4 experiments p≥0.05). (C) Comparative whole body characteristics of rats fed with Chow diet (Ctl), High Fat Diet (HFD) and High Fat Diet supplemented with BBR (HFD+BRR) (n=5 experiments **p<0.01 versus Ctl, ## p<0.01 versus HFD, §§ p<0.01 versus HFD, ++ p<0.01 versus Ctl, & p<0.05 versus HFD, p<0.05 versus HFD). (D and E) Plasma glucose concentrations at the indicated time points after glucose challenge were measured (D) and values for areas under the insulin curve were calculated (E) in rats fed with Chow diet (Ctl), High Fat Diet (HFD) and High Fat Diet supplemented with BBR (HFD+BRR) (n=5 experiments **p<0.01 versus Ctl, # p<0.05 versus HFD). (F) Leptin and Adiponectin content in the plasma of rats fed with Chow diet (Ctl), High Fat Diet (HFD) and High Fat Diet supplemented with BBR (HFD+BRR). (n=4 experiments **p<0.01 ***p<0.001 versus Ctl, ### p<0.001 versus HFD &&& p<0.001 versus HFD). All data represent mean±SEM.
Fig. 2
Fig. 2
Berberine Protects from obesity-induced skeletal muscle mitochondrial dysfunction in Sprague–Dawley Rats. (A) State 3 respiration and FCCP-induced respiration of isolated skeletal muscle mitochondria from rats fed with Chow diet (Ctl), High Fat Diet (HFD) and High Fat Diet supplemented with BBR (HFD+BRR) measured polarographically and expressed in nAtomsO/min/mg protein (n=5 experiments **p<0.01 versus Ctl, # p<0.05 versus Ctl, §§ p<0.01 versus HFD, + p<0.05 versus HFD). (B and C) Succinate Dehydrogenase (B) and Cytochrome c Oxidase (C) activity in skeletal muscle of rats fed with Chow diet (Ctl), High Fat Diet (HFD) and High Fat Diet supplemented with BBR (HFD+BRR) measured polarographically and expressed in nAtomsO/min/mg protein (n=4 experiments *p<0.05 versus Ctl, ## p<0.01 versus HFD). (D) ATPase activity measured spectrophotometrically in skeletal muscle of rats fed with Chow diet (Ctl), High Fat Diet (HFD) and High Fat Diet supplemented with BBR (HFD+BRR) expressed in nmolPi/mgprotein/min (n=4 experiments *p<0.05 versus Ctl, # p<0.05 versus HFD). (E) ATP content in isolated mitochondria from skeletal muscle of rats fed with Chow diet (Ctl), High Fat Diet (HFD) and High Fat Diet supplemented with BBR (HFD+BRR) (n=5 experiments p≥0.05). (F) Amount of oxidative fibers analyzed by the ratio of Troponin 1 slow and Troponin 1 fast mRNA measured by means of quantitative RT-PCR in skeletal muscle of rats fed with Chow diet (Ctl), High Fat Diet (HFD) and High Fat Diet supplemented with BBR (HFD+ BRR) (n=4 experiments p≥0.05). (G) MyHCIIa and MyHCIIb mRNA analyzed by means of quantitative RT-PCR in skeletal muscle of rats fed with Chow diet (Ctl), High Fat Diet (HFD) and High Fat Diet supplemented with BBR (HFD+BRR) (n=4 experiments ** p<0.01 versus Ctl, # p<0.05 versus HFD). (H) Citrate Synthase activity measured spectrophotometrically in skeletal muscle of rats fed with Chow diet (Ctl), High Fat Diet (HFD) and High Fat Diet supplemented with BBR (HFD+BRR) expressed in nmol.mim.ml (n=4 experiments *p<0.05 versus Ctl, # p<0.05 versus HFD). All data represent mean±SEM.
Fig. 3
Fig. 3
SIRT1 is involved in the rescue of mitochondrial dysfunction induced by hyperglycemia and fatty acids in C2C12 myotubes by Berberine. (A and B) Mitochondrial membrane potential measured with TMRM fluorescent probe and normalized to mg of protein in cells after 96 h of treatment with hyperglycemia (25 mM) (A) or fatty acids (FFAs) (B) and exposed to 5 μM BBR, 10 μM DCHC and 5 μM BBR plus 1 μM EX- 527. Data was analyzed as percentage of untreated cells taken as 100% (n=5 experiments *p<0.05 **p<0.01 versus Ctl, ## p<0.01 versus 25 mM or FFAs, § p<0.05 versus 25 mM+BBR or FFAs+BBR, + p<0.05 versus 25 mM or FFAs). (C and D) Cytochrome c Oxidase activity measured polarographically in cells after 96 h of treatment with hyperglycemia (25 mM) (C) or fatty acids (FFAs) (D) and exposed to 5 μM BBR, 10 μM DCHC and 5 μM BBR plus 1 μM EX- 527. Data is expressed in nAtomsO/min/mg protein. (n=4 experiments *p<0.05 **p<0.01 versus Ctl, # p<0.05 versus 25 mM or FFAs, § p<0.05 §§ p<0.01 versus 25 mM+BBR or FFAs+BBR, + p<0.05 versus 25 mM or FFAs). (E and F) Citrate Synthase activity measured spectrophotometrically in cells after 96 h of treatment with hyperglycemia (25 mM) (E) or fatty acids (FFAs) (F) and exposed to 5 μM BBR, 10 μM DCHC and 5 μM BBR plus 1 μM EX- 527. Data is expressed in nAtomsO/min/mg protein. (n=4 experiments ***p<0.001 *p<0.05 versus Ctl, # p<0.05 versus 25 mM or FFAs, §§ p<0.01 § p<0.05 versus 25 mM+BBR or FFAs+BBR, + p<0.05 versus 25 mM or FFAs). All data represent mean±SEM.
Fig. 4
Fig. 4
Berberine rescues mitochondrial dysfunction and mitochondrial biogenesis induced by hyperglycemia in a SIRT1-dependent manner in C2C12 myoblasts. (A) Representative Immunoblot for SIRT1 and Actin in C2C12 cells infected with SIRT1 Sh RNA (Sh SIRT1) or non targeting Sh RNA (Sh Ctl). (B and C) Mitochondrial membrane potential measured with TMRM fluorescent probe (B) and ATP content (C) measured in C2C12 cells infected with SIRT1 shRNA (Sh SIRT1) or nontargeting shRNA (Sh Ctl) after 96 h of treatment with hyperglycemia (25 mM) and 5 μM BBR. (n=5 experiments *p<0.05 **p<0.01 versus Ctl, # p<0.05 versus 25 mM, § p<0.05 versus 25 mM+BBR). (D) Mitochondrial DNA amount analyzed by means of quantitative PCR in C2C12 cells infected with SIRT1 shRNA (Sh SIRT1) or nontargeting shRNA (sh Ctl) after 96 h of treatment with hyperglycemia (25 mM) and 5 μM BBR. Relative units are expressed in comparison to untreated cells taken as 1.0. (n=5 experiments **p<0.01 versus Ctl, ## p<0.01 versus 25 mM, §§ p<0.01 versus 25 mM+BBR). (E) Mitochondrial mass measured by quantification of NAO intensity in C2C12 cells infected with SIRT1 shRNA (Sh SIRT1) or nontargeting shRNA (sh Ctl) after 96 h of treatment with hyperglycemia (25 mM) and 5 μM BBR. Data is expressed as percentage of untreated cells taken as 100% (n=5 experiments *p<0.05 versus Ctl, ## p<0.01 versus 25 mM, §§ p<0.01 versus 25 mM+BBR). All data represent mean±SEM.
Fig. 5
Fig. 5
Berberine regulates mitochondrial biogenesis in a SIRT1-dependent manner in C2C12 myoblasts and also in skeletal muscle of Sprague–Dawley Rats. (A) PGC-1alpha, PGC-1beta, NRF-1, NRF-2, TFAM, TFB1M and TFB2M mRNA analyzed by means of quantitative RT-PCR in C2C12 cells infected with SIRT1 shRNA (Sh SIRT1) or nontargeting shRNA (sh Ctl) after 96 h of treatment with hyperglycemia (25 mM) and 5 μM BBR. Relative expression values of the untreated cells were taken as 1.0. (n=4 experiments **p<0.01 versus Ctl, # p<0.05 versus 25 mM, § p<0.05 versus 25 mM+BBR). (B) NDUFS8, ND1, COX5b, COX1 mRNA analyzed by means of quantitative RT-PCR in C2C12 cells infected with SIRT1 shRNA (Sh SIRT1) or nontargeting shRNA (sh Ctl) after 96 h of treatment with hyperglycemia (25 mM) and 5 μM BBR. Relative expression values of the untreated cells were taken as 1.0. (n=4 experiments **p<0.01 versus Ctl, # p<0.05 versus 25 mM, § p<0.05 versus 25 mM+BBR). (C) Representative Immunoblot for SIRT1, PGC-1alpha, NRF-1, TFAM, COXIV and Actin in C2C12 cells infected with SIRT1 shRNA (Sh SIRT1) or nontargeting shRNA (sh Ctl) after 96 h of treatment with hyperglycemia (25 mM) and 5 μM BBR. (D) Representative immunoblot for PGC-1alpha, TFAM, COXI, COXIV and Actin in skeletal muscle of rats fed with Chow diet (Ctl), High Fat Diet (HFD) and High Fat Diet supplemented with BBR (HFD+BRR). (E) PGC-1alpha, TFAM, COX4, COX2 mRNA analyzed by means of RT-PCR in skeletal muscle of rats fed with Chow diet (Ctl), High Fat Diet (HFD) and High Fat Diet supplemented with BBR (HFD+BRR). (n=4 experiments *p<0.05 **p<0.01 versus Ctl, # p<0.05 ## p<0.01 versus HFD). All data represent mean±SEM.
Fig. 6
Fig. 6
Berberine increases NAD+/NADH ratio through induction of NAMPT expression in C2C12 cells. (A) NAD+/NADH ratio measured spectophotometricaly in C2C12 myotubes treated for 96 h with hyperglycemia and exposed to 5 μM BBR (n=4 experiments ***p<0.001 Ctl, ## p<0.01 versus 25 mM). (B) NAD+/NADH ratio measured spectophotometricaly in C2C12 myoblasts treated for 6 h, 12 h and 24 h with 5 μM BBR (n=4 experiments *p<0.05 **p<0.01 versus Ctl). (C) NAMPT mRNA analyzed by means of quantitative RT-PCR in C2C12 cells after 6 h, 12 h and 24 h of treatment with 5 μM BBR. Relative expression values of the untreated cells were taken as 1.0. (n=4 experiments *p<0.05 **p<0.01 versus Ctl). (D) PGC-1alpha, PGC1-beta, NRF-1, NRF-2, TFAM, NDUFS8, ND1, COX5b, COX1 mRNA analyzed by means of quantitative RT-PCR in C2C12 cells after 12 h of treatment with 5 μM BBR or 5 μM BBR+10 nM FK866. Relative expression values of the untreated cells were taken as 1.0. (n=4 experiments *p<0.05 **p<0.01 ***p<0.001 versus Ctl, # p<0.05 ## p<0.01 ### p<0.001 versus BBR). All data represent mean±SEM.
Fig. 7
Fig. 7
Berberine activates AMPK in skeletal muscle of Sprague–Dawley Rats and in C2C12 myoblasts in a SIRT1-dependent way. (A) Representative Immunoblot for total AMPK, p-AMPK (Thr172), total ACC and p-ACC (Ser79) in C2C12 cells infected with SIRT1 shRNA (Sh SIRT1) or nontargeting shRNA (sh Ctl) after 96 h of treatment with hyperglycemia (25 mM) and to 5 μM BBR. (B) Quantification of AMPK activation by Berberine in C2C12 cells infected with SIRT1 shRNA (Sh SIRT1) or nontargeting shRNA (sh Ctl) after 96 h of treatment with hyperglycemia (25 mM) and to 5 μM BBR. (n=4 experiments *p<0.05 versus Ctl, # p<0.05 versus 25 mM, § p<0.05 versus 25 mM+BBR. (C) AMPK activity accessed by immunoblot in skeletal muscle of rats fed with Chow diet (Ctl), High Fat Diet (HFD) and High Fat Diet supplemented with BBR (HFD+BRR). A representative immunoblot is shown for total AMPK and p-AMPK(Thr172). (D) LCAD, MCAD and CPT1b mRNA analyzed by means of quantitative RT-PCR in C2C12 cells infected with SIRT1 shRNA (Sh SIRT1) or nontargeting shRNA (sh Ctl) after 96 h of treatment with hyperglycemia (25 mM) and to 5 μM BBR. Relative expression values of the untreated cells were taken as 1.0. (n=4 experiments *p<0.05 **p<0.01 versus Ctl, # p<0.05 versus 25 mM, § p<0.05 versus 25 mM+BBR). All data represent mean±SEM.
Fig. 8
Fig. 8
Different concentrations of Berberine have different effects in mitochondrial function in C2C12. (A) Mitochondrial membrane potential measured with TMRM fluorescent probe (B) and NAD+/NADH ratio measured spectophotometricaly in C2C12 cells after 6 h, 12 h and 24 h of treatment with 5 μM and 20 μM BBR. (n=4 experiments *p<0.05 **p<0.01 versus DMSO, # p<0.05 ## p<0.01 ### p<0.001 versus DMSO). (C) ATP content measured in C2C12 cells infected with SIRT1 shRNA (Sh SIRT1) or nontargeting shRNA (sh Ctl) after 6 h, 24 h, 48 h and 96 h of treatment with hyperglycemia (25 mM), 5 μM and 20 μM BBR. (n=4 experiments **p<0.01 versus Ctl, # p<0.05 ## p<0.01 ### p<0.001 versus 25 mM, § p<0.05 §§ p<0.01 versus 25 mM+BBR). All data represent mean±SEM.

References

    1. Kopelman PG. Obesity as a medical problem. Nature. 2000;404:635–643. - PubMed
    1. Haslam DW, James WP. Obesity. Lancet. 2005;366:1197–1209. - PubMed
    1. Hegarty BD, Furler SM, Ye J, Cooney G, Kraegen EW. The role of intramuscular lipid in insulin resistance. Acta Physiol Scand. 2003;178:373–383. - PubMed
    1. Muoio DM, Newgard CB. Obesity-related derangements in metabolic regulation. Annu Rev Biochem. 2006;75:367–401. - PubMed
    1. Krebs M, Roden M. Nutrient-induced resistance in human skeletal muscle. Curr Med Chem. 2004;11:901–908. - PubMed

Publication types

MeSH terms

LinkOut - more resources