Randomized Controlled Trial
. 2012 Jan 15;302(2):E190-200.
doi: 10.1152/ajpendo.00207.2011. Epub 2011 Oct 25.

Insulin resistance after a 72-h fast is associated with impaired AS160 phosphorylation and accumulation of lipid and glycogen in human skeletal muscle

Affiliations
Randomized Controlled Trial

Insulin resistance after a 72-h fast is associated with impaired AS160 phosphorylation and accumulation of lipid and glycogen in human skeletal muscle

M H Vendelbo et al. Am J Physiol Endocrinol Metab. .

Abstract

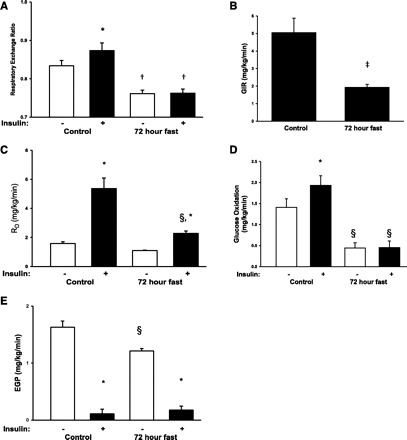
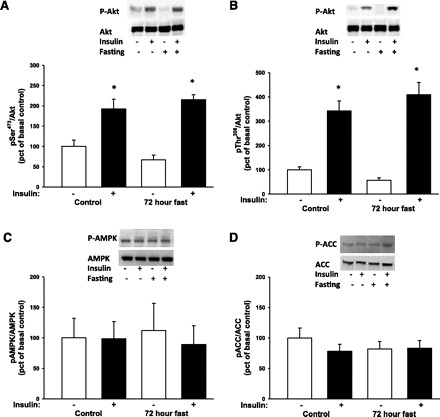
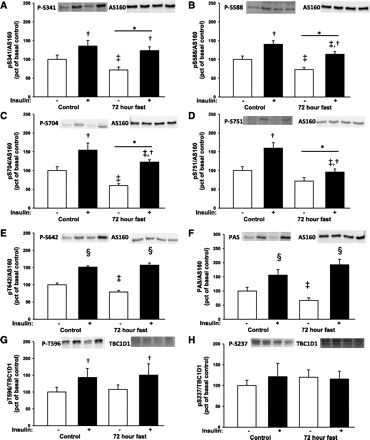
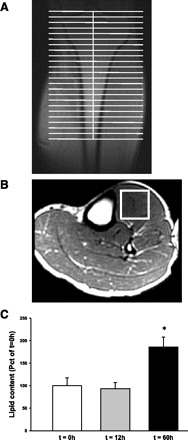
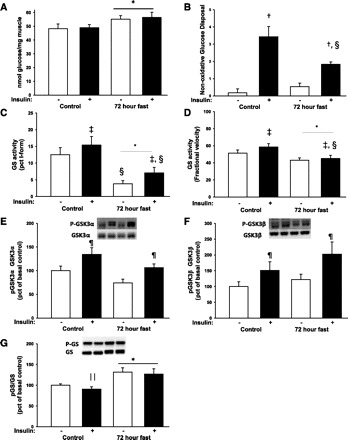
During fasting, human skeletal muscle depends on lipid oxidation for its energy substrate metabolism. This is associated with the development of insulin resistance and a subsequent reduction of insulin-stimulated glucose uptake. The underlying mechanisms controlling insulin action on skeletal muscle under these conditions are unresolved. In a randomized design, we investigated eight healthy subjects after a 72-h fast compared with a 10-h overnight fast. Insulin action on skeletal muscle was assessed by a hyperinsulinemic euglycemic clamp and by determining insulin signaling to glucose transport. In addition, substrate oxidation, skeletal muscle lipid content, regulation of glycogen synthesis, and AMPK signaling were assessed. Skeletal muscle insulin sensitivity was reduced profoundly in response to a 72-h fast and substrate oxidation shifted to predominantly lipid oxidation. This was associated with accumulation of both lipid and glycogen in skeletal muscle. Intracellular insulin signaling to glucose transport was impaired by regulation of phosphorylation at specific sites on AS160 but not TBC1D1, both key regulators of glucose uptake. In contrast, fasting did not impact phosphorylation of AMPK or insulin regulation of Akt, both of which are established upstream kinases of AS160. These findings show that insulin resistance in muscles from healthy individuals is associated with suppression of site-specific phosphorylation of AS160, without Akt or AMPK being affected. This impairment of AS160 phosphorylation, in combination with glycogen accumulation and increased intramuscular lipid content, may provide the underlying mechanisms for resistance to insulin in skeletal muscle after a prolonged fast.


Figures

Fig. 1.
Fig. 1.
A: the respiratory exchange ratio (RER) was assessed before and after insulin stimulation after an overnight fast of 10 h (control condition) and after a 72-h fast. Throughout the figure, open bars indicate no insulin stimulation and filled bars indicate insulin stimulation. There was a significant interaction between insulin stimulation and fasting conditions (P < 0.05), and post hoc test showed that insulin increased RER only in the control condition (*P < 0.05 vs. basal within experimental day), and RER was reduced during fasting under both basal and insulin-stimulated situations (†P < 0.05 vs. control within insulin or basal). B: insulin sensitivity was assessed by a hyperinsulinemic euglycemic clamp. Insulin was infused at a rate of 0.8 mU·kg−1·min−1. The glucose infusion rate (GIR) under the last 30 min of the clamp was ∼60% lower after a 72-h fast (‡P < 0.05). C: the reduced GIR after 72 h of fasting was associated with a reduced rate of disappearance (Rd) for glucose. There was a significant interaction between insulin stimulation and fasting conditions (P < 0.01), and post hoc test showed that Rd during fasting was reduced by ∼60% (§P < 0.01 vs. control within insulin/basal). Although the effect of insulin was reduced after 72 h of fasting, there was still a significant increase in Rd during control and fasting conditions. Basal Rd was not reduced by fasting. D: 72-h fasting reduced glucose oxidation. There was a significant interaction between insulin stimulation and fasting conditions (P < 0.05), and insulin increased glucose oxidation only in the control condition. Glucose oxidation was decreased under both basal and insulin-stimulated conditions during fasting. E: similarly to Rd, endogenous glucose production (EGP) was reduced during fasting, and there was a significant interaction between insulin stimulation and fasting conditions (P < 0.01). Post hoc test showed that this was associated with reduced basal EGP during fasting, whereas insulin suppressed EGP in both situations. The EGP during insulin stimulation was similar after 72-h fasting compared with the control situation.
Fig. 2.
Fig. 2.
Phosphorylation (p) of the intracellular kinases Akt, AMP-activated protein kinase (AMPK), and acetyl-CoA carboxylase (ACC) in muscle biopsies taken before and during a hyperinsulinemic euglycemic clamp was assessed by Western blot analysis. Throughout the figure, open bars indicate no insulin stimulation and filled bars indicate insulin stimulation. A and B: there was a main effect of insulin stimulation, but not fasting, on Akt Ser473 and Thr308 under both control and fasting conditions (*P < 0.001). Post hoc tests showed no difference between experiment days within basal or insulin-stimulated situations. C and D: 72 h of fasting and insulin stimulation did not affect phosphorylation of the AMPK or the downstream target ACC.
Fig. 3.
Fig. 3.
Site-specific phosphorylation of Akt substrate of 160 kDa (AS160) and phospho-Akt substrate (PAS) phosphorylation in muscle biopsies taken before and during a hyperinsulinemic euglycemic clamp was assessed by Western blot analysis. Throughout the figure, open bars indicate no insulin stimulation and filled bars indicate insulin stimulation. Representative blots show from left to right control situation before and after insulin stimulation and fasting conditions before and after insulin stimulation. A: there was main effect of a 72-h fast (*P < 0.05) and insulin stimulation (†P < 0.01) on Ser341 phosphorylation. Post hoc test showed a decrease in basal phosphorylation during fasting (‡P < 0.05 vs. control within insulin or basal) B: there was a main effect of a 72-h fast and insulin stimulation on Ser588 phosphorylation. Post hoc test showed that both basal and insulin-stimulated phosphorylation were reduced during fasting. C: there was a main effect of a 72-h fast and insulin stimulation on Ser704 phosphorylation. D: there was a main effect of a 72-h fast and insulin stimulation on Ser751 phosphorylation. E and F: there was a significant interaction of insulin and a 72-h fast (P < 0.001) on Thr642 or AS160 PAS phosphorylation. Post hoc test showed a significant insulin effect (§P < 0.001 vs. basal within experimental day). Basal phosphorylation was reduced during fasting, whereas insulin-stimulated phosphorylation was similar under fasting and control conditions. G: phosphorylation of the Akt consensus site Thr596 on TBC1D1 was increased during insulin stimulation (main effect of insulin P < 0.05), but there was no main effect of fasting. H: TBC1D1 phosphorylation at Ser237, an AMPK consensus site, was not affected by fasting or insulin.
Fig. 4.
Fig. 4.
Intramuscular lipid content was determined by 1H-magnetic resonance spectroscopy. The patients were examined after 0, 12, and 60 h of fasting. A: to obtain muscle spectroscopy, volunteers were positioned in the supine position with feet first in the magnet bore and the left calf placed in a standard radio frequency transmit-receive extremity coil for radio frequency transmission and signal reception. B: a representative picture of an oblique plane T1-weighted gradient echo pulse sequence that was performed to enable identification of the area of interest. The volume of interest (white box) was positioned in a homogeneous part of the tibialis anterior muscle, avoiding visible vessels and connective tissue. The lipid content was quantified and presented as %t = 0 (open bar) and after 12 (gray bar) and 60 h of fasting (black bar). The lipid content increased ∼2-fold after 60 h of fasting, whereas no change was seen after a 12-h fast (*P < 0.01 vs. t = 0).
Fig. 5.
Fig. 5.
Glycogen content and regulation of glycogen metabolism were determined before and after a hyperinsulinemic euglycemic clamp. Throughout the figure, open bars indicate a non-insulin-stimulated condition and filled bars indicate insulin stimulation. A: there was a main effect of fasting on glycogen levels (*P < 0.05) with increased glycogen content in skeletal muscle after a 72-h fast. B: this was associated with a decreased, insulin-stimulated, nonoxidative glucose disposal after 72 h of fasting (fasting-insulin interaction, P < 0.05). Post hoc test showed that insulin increased nonoxidative glucose disposal (†P < 0.001 vs. basal within experimental day), but the insulin-stimulated level was significantly lower during fasting (§P < 0.05 vs. control within insulin or basal). There were no differences between experimental days in nonoxidative glucose disposal within the non-insulin-stimulated condition. C and D: glycogen synthase (GS) activity was reduced during fasting when measured as both %I-form (glucose 6-phosphate-independent GS activity) and as %fractional velocity (main effect of fasting, P < 0.05). Insulin stimulated GS activity under both fasting and control conditions (‡main effect of insulin, P < 0.05). Post hoc tests showed that both basal and insulin-stimulated GS activity as %I-form were reduced during fasting, whereas %fractional velocity was reduced only in the insulin-stimulated form. E and F: representative blots show from left to right control situation before and after insulin stimulation and fasting conditions before and after insulin stimulation. Insulin increased phosphorylation of the upstream kinase glycogen synthase kinase-3 (GSK-3; main effect of insulin: ¶P < 0.001), but there was no effect of 72 h of fasting. G: phosphorylation of GS increased after fasting. There was a trend toward reduced GS phosphorylation after insulin stimulation, but this did not reach statistical significance (main effect of insulin: P = 0.051), and post hoc test showed a significant reduction only with insulin stimulation within the control situation (∥P < 0.05 vs. basal within experimental day).

References

    1. An D, Toyoda T, Taylor EB, Yu H, Fujii N, Hirshman MF, Goodyear LJ. TBC1D1 regulates insulin- and contraction-induced glucose transport in mouse skeletal muscle. Diabetes 59: 1358–1365, 2010. - PMC - PubMed
    1. Bergman BC, Cornier MA, Horton TJ, Bessesen DH. Effects of fasting on insulin action and glucose kinetics in lean and obese men and women. Am J Physiol Endocrinol Metab 293: E1103–E1111, 2007. - PubMed
    1. Bernard C. Leçons Sur Les Propriétés Physiologiques et Les Altérations Pathologiques des Liquides de L'organisme. Paris: Ballière, 1859, p. 79.
    1. Björkman O, Eriksson LS. Influence of a 60-hour fast on insulin-mediated splanchnic and peripheral glucose metabolism in humans. J Clin Invest 76: 87–92, 1985. - PMC - PubMed
    1. Bondar RJ, Mead DC. Evaluation of glucose-6-phosphate dehydrogenase from Leuconostoc mesenteroides in the hexokinase method for determining glucose in serum. Clin Chem 20: 586–590, 1974. - PubMed

Publication types

LinkOut - more resources