. 2011 Oct;7(10):e1002225.
doi: 10.1371/journal.pcbi.1002225. Epub 2011 Oct 20.

Replication timing: a fingerprint for cell identity and pluripotency

Affiliations

Replication timing: a fingerprint for cell identity and pluripotency

Tyrone Ryba et al. PLoS Comput Biol. 2011 Oct.

Abstract

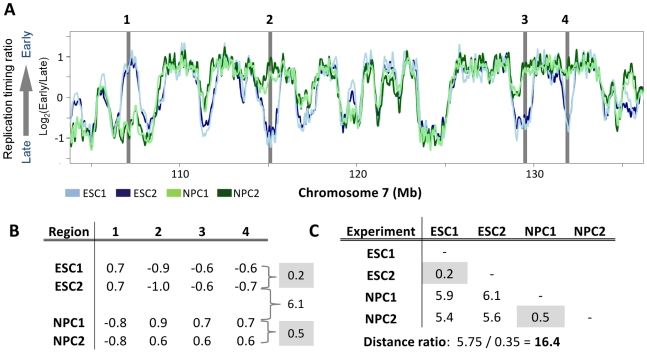
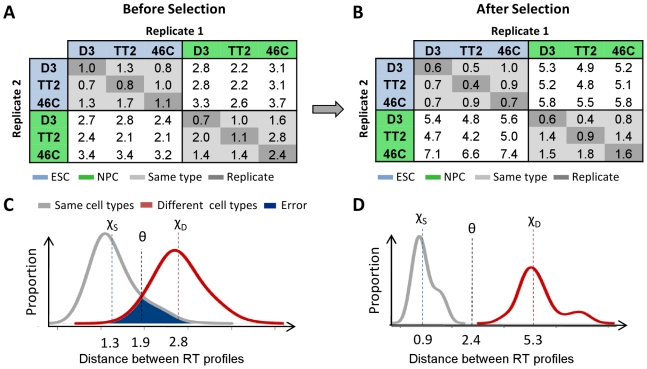
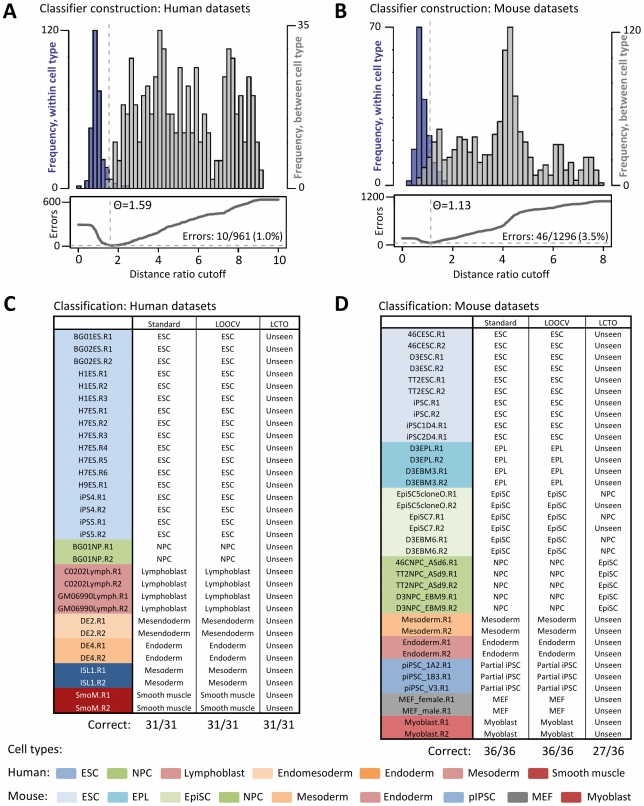
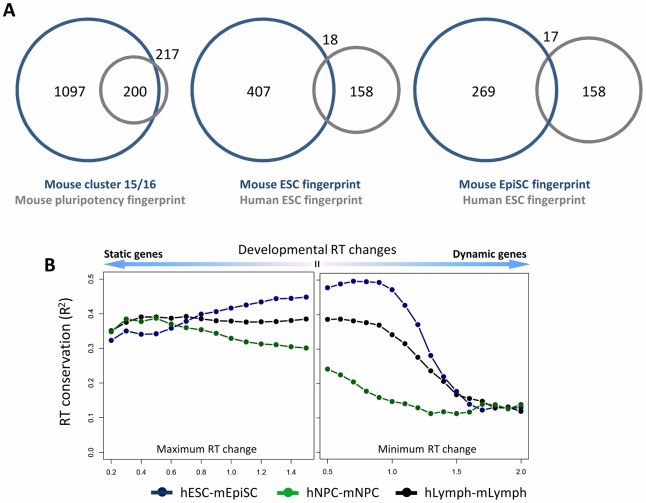
Many types of epigenetic profiling have been used to classify stem cells, stages of cellular differentiation, and cancer subtypes. Existing methods focus on local chromatin features such as DNA methylation and histone modifications that require extensive analysis for genome-wide coverage. Replication timing has emerged as a highly stable cell type-specific epigenetic feature that is regulated at the megabase-level and is easily and comprehensively analyzed genome-wide. Here, we describe a cell classification method using 67 individual replication profiles from 34 mouse and human cell lines and stem cell-derived tissues, including new data for mesendoderm, definitive endoderm, mesoderm and smooth muscle. Using a Monte-Carlo approach for selecting features of replication profiles conserved in each cell type, we identify "replication timing fingerprints" unique to each cell type and apply a k nearest neighbor approach to predict known and unknown cell types. Our method correctly classifies 67/67 independent replication-timing profiles, including those derived from closely related intermediate stages. We also apply this method to derive fingerprints for pluripotency in human and mouse cells. Interestingly, the mouse pluripotency fingerprint overlaps almost completely with previously identified genomic segments that switch from early to late replication as pluripotency is lost. Thereafter, replication timing and transcription within these regions become difficult to reprogram back to pluripotency, suggesting these regions highlight an epigenetic barrier to reprogramming. In addition, the major histone cluster Hist1 consistently becomes later replicating in committed cell types, and several histone H1 genes in this cluster are downregulated during differentiation, suggesting a possible instrument for the chromatin compaction observed during differentiation. Finally, we demonstrate that unknown samples can be classified independently using site-specific PCR against fingerprint regions. In sum, replication fingerprints provide a comprehensive means for cell characterization and are a promising tool for identifying regions with cell type-specific organization.


Conflict of interest statement

The authors have declared that no competing interests exist.

Figures

Figure 1
Figure 1. A simplified replication timing fingerprint.
A. Four 200 kb regions in chromosome 7, highlighted in grey, are selected for a simplified fingerprint using two replicates each of ESCs (light and dark blue) and NPCs (light and dark green). B. The replication timing ratio for each region in each experiment is shown, with the total distances in replication timing for all fingerprinting regions between replicates of ESCs or NPCs in grey. Note that distances between the two different cell types (ESC vs. NPC) are substantially higher than those between replicate profiles (e.g., 6.1 for ESC2 vs. NPC1; shown between the grey boxes). C. Total differences in replication timing for all four fingerprinting regions between all combinations of the two replicates from these two cell types are shown. Highlighted in grey are the values for the two replicates of each cell type, which are considerably less than the values for any of the inter-cell type comparisons. Shown below the table is the “Distance ratio”, calculated as the average distance between cell types (or between replicates) divided by the average distance within cell types. The Distance ratio represents the degree of separation between replication profiles in regions used for classification.
Figure 2
Figure 2. Monte Carlo optimization of fingerprinting regions.
A Monte Carlo algorithm is used to select regions with maximal differences in replication timing between cell types and minimal differences between replicates to obtain an optimized set of genomic regions for classification using the nearest-neighbor method. A,B. Selection of fingerprinting regions accentuates differences between cell types while diminishing those within equivalent cell types (light gray) and replicates (dark gray). C,D. To calculate confidence levels of predictions we use the distributions of distances within (grey) and between (red) cell types, shown here for 30 runs before and after selection. The error rate of prediction is represented by the blue shaded area shared by comparisons between similar or distinct cell types, with average distances of χS and χD respectively. The optimal classifier, θ, is estimated by minimizing the number of misclassified distances as in Figure 3 and Figure 4. Above this distance, datasets are predicted to originate from different cell types.
Figure 3
Figure 3. Cell type classification using Monte-Carlo selected domains.
A,B. (Top panel) Distribution of distances within (blue) and between (gray) all human replication profiles for consensus fingerprinting domains in human (A) and mouse (B) cell types. (Bottom panel) Number of classification errors as a function of distance ratio cutoff. The optimal classifier (θ) is that which minimizes classification errors, with distances above θ hypothesized to originate from different cell types. C,D. Human dataset classification results for the standard kNN method (Standard) leave-one-out crossvalidation (LOOCV), and with each cell type excluded from training (LCTO). For LOOCV, each experiment (e.g., BG01ES.R1) is classified using 20 regions selected with that experiment left out. For LCTO, experiments are labeled as the most similar type in the training set, or correctly classified as “Unseen” for distances above θ. Experimental replicates are denoted with suffixes ‘R1’, ‘R2’, etc, and are described in Table S1.
Figure 4
Figure 4. Identification of cell type- and pluripotency-specific regions.
A. Construction of a general classifier for distinguishing pluripotent from committed mouse and human cell types, with results summarized in the tables below for the standard kNN method and leave-one-out crossvalidation. B. Representative fingerprint regions are shown for three cases: general classification (left), distinguishing pluiripotent vs. committed cell types (middle), and identifying cell-type-specific (here, lymphoblast-specific) regions (right). Lines represent averaged profiles for each cell type. Several EtoL regions in the pluripotency fingerprint contain genes known to function in maintaining stem cell identity, such as Dickkopf homolog DKK1, while uniquely early regions in cell type-specific fingerprints often feature genes with relevant functional or disease associations, such as IKZF1 in lymphoblast cells.
Figure 5
Figure 5. Conservation of mouse and human pluripotency fingerprint genes.
A. Venn diagram showing the overlap in genes that fail to reprogram expression in partial iPSCs (clusters 15 and 16 in Hiratani et al., 2010) and the mouse pluripotency fingerprint (left), between the human and mouse ESC fingerprints (middle), and the human ESC and mouse EpiSC fingerprint (right). B. Conservation (R2) of replication timing between human and mouse lymphoblasts (hLymph-mLymph), neural precursors (hNPC-mNPC) and primed stem cells (hESC-mEpiSC) as a function of developmental timing changes. For the most closely aligned samples, both relatively static and highly dynamic regions show a decreased alignment in replication timing between species.
Figure 6
Figure 6. Independent verification of fingerprint classification by PCR.
A. NC-NC lymphoblasts and WIBR3 hESCs were BrdU labeled, early and late nascent strands were purified as for all other cells, and nascent strands were analyzed blindly by PCR using primers specific to 20 human fingerprint regions and control regions (mito: mitochondrial DNA, α-globin, β-globin). Replication times are represented by the relative abundance of each sequence in early S phase as a fraction of its abundance in both early and late S. Error bars depict the average and SEM for each locus after 6 replicate experiments. B. Euclidean distances between replication profiles measured in fingerprint regions described in Table 1, after rescaling PCR values to array scale. Color scale for numbers relates the relative similarity of cell types in fingerprint regions, from highly similar (red) to highly divergent (blue). The three lowest distances used for kNN classification (k = 3) are highlighted in bold font, with unknown samples #1 and #2 correctly designated as lymphoblasts and ESCs, respectively using the three shortest distances.

References

    1. Yaffe E, Farkash-Amar S, Polten A, Yakhini Z, Tanay A, et al. Comparative analysis of DNA replication timing reveals conserved large-scale chromosomal architecture. PLoS Genet. 2010;6:e1001011. - PMC - PubMed
    1. Woodfine K, Fiegler H, Beare DM, Collins JE, McCann OT, et al. Replication timing of the human genome. Hum Mol Genet. 2004;13:191–202. - PubMed
    1. Ryba T, Hiratani I, Lu J, Itoh M, Kulik M, et al. Evolutionarily conserved replication timing profiles predict long-range chromatin interactions and distinguish closely related cell types. Genome Res. 2010;20:761–70. - PMC - PubMed
    1. Hiratani I, Ryba T, Itoh M, Yokochi T, Schwaiger M, et al. Global reorganization of replication domains during embryonic stem cell differentiation. PLoS Biol. 2008;6:e245. - PMC - PubMed
    1. Hiratani I, Ryba T, Itoh M, Rathjen J, Kulik M, et al. Genome-wide dynamics of replication timing revealed by in vitro models of mouse embryogenesis. Genome Res. 2010;20:155–69. - PMC - PubMed

Publication types