. 2011 Oct;7(10):e1002328.
doi: 10.1371/journal.ppat.1002328. Epub 2011 Oct 20.

Exhausted cytotoxic control of Epstein-Barr virus in human lupus

Affiliations

Exhausted cytotoxic control of Epstein-Barr virus in human lupus

Martin Larsen et al. PLoS Pathog. 2011 Oct.

Abstract

Systemic Lupus Erythematosus (SLE) pathology has long been associated with an increased Epstein-Barr Virus (EBV) seropositivity, viremia and cross-reactive serum antibodies specific for both virus and self. It has therefore been postulated that EBV triggers SLE immunopathology, although the mechanism remains elusive. Here, we investigate whether frequent peaks of EBV viral load in SLE patients are a consequence of dysfunctional anti-EBV CD8+ T cell responses. Both inactive and active SLE patients (n = 76 and 42, respectively), have significantly elevated EBV viral loads (P = 0.003 and 0.002, respectively) compared to age- and sex-matched healthy controls (n = 29). Interestingly, less EBV-specific CD8+ T cells are able to secrete multiple cytokines (IFN-γ, TNF-α, IL-2 and MIP-1β) in inactive and active SLE patients compared to controls (P = 0.0003 and 0.0084, respectively). Moreover, EBV-specific CD8+ T cells are also less cytotoxic in SLE patients than in controls (CD107a expression: P = 0.0009, Granzyme B release: P = 0.0001). Importantly, cytomegalovirus (CMV)-specific responses were not found significantly altered in SLE patients. Furthermore, we demonstrate that EBV-specific CD8+ T cell impairment is a consequence of their Programmed Death 1 (PD-1) receptor up-regulation, as blocking this pathway reverses the dysfunctional phenotype. Finally, prospective monitoring of lupus patients revealed that disease flares precede EBV reactivation. In conclusion, EBV-specific CD8+ T cell responses in SLE patients are functionally impaired, but EBV reactivation appears to be an aggravating consequence rather than a cause of SLE immunopathology. We therefore propose that autoimmune B cell activation during flares drives frequent EBV reactivation, which contributes in a vicious circle to the perpetuation of immune activation in SLE patients.


Conflict of interest statement

The authors have declared that no competing interests exist.

Figures
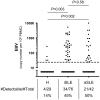
Figure 1
Figure 1. Cell-associated EBV viral load in SLE patients.
qPCR measurements of EBV genomes per 106 PBMCs from EBV seropositive healthy controls (H, n = 29), inactive (iSLE, n = 76) and active (aSLE, n = 42) SLE patients. The absolute number and the frequency of individuals having viral loads above the detection limit of 25 viral genomes per 106 PBMCs (dotted line) are indicated. Group comparisons are performed with Fisher's exact test.
Figure 2
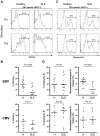
Figure 2. Multiparametric functional assessment of EBV- and CMV-specific CD8+ T cells in SLE patients.
(A) Representative cytofluorometric detection (left) and functional analysis (right) of CD8+ T cells specific for one of the lytic EBV antigens tested (BZLF1) in a healthy control (upper panel) and in an inactive SLE patient (lover panel) post peptide antigen stimulation of PBMC. Lytic EBV and CMV antigen-specific cells were detected with peptide/MHC tetramer and anti-CD8 antibody (red box) and simultaneously analyzed for intra-cellular IFN-γ, TNF-α, IL-2 and MIP-1β content. Cytokine/chemokine gates were positioned according to control stains of non-stimulated virus-specific T cells. (B) Magnitude and (C) functionality of EBV- (upper panel) and CMV-specific (lower panel) responses in healthy controls (H, n = 26 and 15, respectively), inactive (i, n = 19 and 10) and active (a, n = 27 and 11) SLE patients. (D) EBV-specific T cells (upper panel) are strikingly less polyfunctional in inactive (iSLE) and active (aSLE) SLE patients compared to controls (healthy), while polyfunctionality of CMV-specific responses (lower panel) is preserved. Pie representations of virus-specific CD8+ T cells represent the fraction of individual cells secreting none (0) or any (1, 2, 3 or 4) of the four cytokines IFN-γ, TNF-α, IL-2 and MIP-1β (color coded as indicated). E.g. the red pie slice indicates the proportion of cells producing four cytokines (IFN-γ, TNF-α, IL-2 and MIP-1β). P-values monitoring differences between healthy donors and SLE patients are calculated using a non-parametric Mann-Whitney test and pie comparison statistics of the Spice software.
Figure 3
Figure 3. Lytic EBV antigen-specific T cells from SLE patients are impaired in their ability to release their cytotoxic granule content.
Representative analysis of (A) CD107a and (C) granzyme B expression in CD8+ T cells, specific for one of the lytic EBV antigens tested (BZLF1), from healthy control and SLE patient either ex vivo (upper panel) or following cognate antigen stimulation (lower panel). As shown, EBV-specific CD8+ T cells from SLE patients are much less able to mobilize surface CD107a and release their granzyme B content upon cognate antigen stimulation. (B) Mobilization of CD107a on the surface of EBV- (upper panel) and CMV-specific (lower panel) CD8+ T cells upon cognate antigen stimulation over night. (D) Ex vivo analysis of the frequency of granzyme B expression in EBV- and CMV-specific CD8+ T cells from healthy controls (n = 17 and 11, respectively) and SLE patients (n = 14 and 12) (left panel), as well as the frequency of EBV- and CMV- specific CD8+ T cells positive for granzyme B capable of releasing their granzyme B upon cognate antigen stimulation (right panel). Healthy controls are compared to SLE patients using a non-parametric Mann-Whitney test.
Figure 4
Figure 4. Blockade of PD-1 signalling revigorates EBV-specific T cell responses.
Cytofluorometric analysis of PD-1 expression on lytic (black circles) and latent (red triangles) EBV- (upper panel) as well as CMV-specific (lower panel) CD8+ T cells. (B) Overall cell growth, (C) virus-specific T cell expansion and (D) IFN-γ secretion by peripheral virus-specific CD8+ T cells from healthy controls (H) and SLE patients (SLE) stimulated for 10 days with EBV cognate antigen in the presence (+) or absence (−) of PD-L1 and PD-L2 antagonistic antibodies. Statistical comparisons are performed using (A) Mann-Whitney and (B–D) Wilcoxon matched pairs test.
Figure 5
Figure 5. Longitudinal monitoring of EBV replication following SLE flare onset.
EBV viral load as genome copies per 106 PBMCs (black line) and synchronous disease activity (gray shading, SLEDAI≥6) in (A) 6 SLE patients and (B) 5 healthy controls.

References

    1. James JA, Harley JB, Scofield RH. Role of viruses in systemic lupus erythematosus and Sjogren syndrome. Curr Opin Rheumatol. 2001;13:370–376. - PubMed
    1. Munz C, Lunemann JD, Getts MT, Miller SD. Antiviral immune responses: triggers of or triggered by autoimmunity? Nat Rev Immunol. 2009;9:246–258. - PMC - PubMed
    1. Evans AS, Rothfield NF, Niederman JC. Raised antibody titres to E.B. virus in systemic lupus erythematosus. Lancet. 1971;1:167–168. - PubMed
    1. Alspaugh MA, Henle G, Lennette ET, Henle W. Elevated levels of antibodies to Epstein-Barr virus antigens in sera and synovial fluids of patients with rheumatoid arthritis. J Clin Invest. 1981;67:1134–1140. - PMC - PubMed
    1. Barzilai O, Ram M, Shoenfeld Y. Viral infection can induce the production of autoantibodies. Curr Opin Rheumatol. 2007;19:636–643. - PubMed

Publication types

MeSH terms