. 2011;6(10):e25086.
doi: 10.1371/journal.pone.0025086. Epub 2011 Oct 18.

Fitting the elementary rate constants of the P-gp transporter network in the hMDR1-MDCK confluent cell monolayer using a particle swarm algorithm

Affiliations

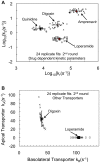
Fitting the elementary rate constants of the P-gp transporter network in the hMDR1-MDCK confluent cell monolayer using a particle swarm algorithm

Deep Agnani et al. PLoS One. 2011.

Abstract

P-glycoprotein, a human multidrug resistance transporter, has been extensively studied due to its importance to human health and disease. In order to understand transport kinetics via P-gp, confluent cell monolayers overexpressing P-gp are widely used. The purpose of this study is to obtain the mass action elementary rate constants for P-gp's transport and to functionally characterize members of P-gp's network, i.e., other transporters that transport P-gp substrates in hMDR1-MDCKII confluent cell monolayers and are essential to the net substrate flux. Transport of a range of concentrations of amprenavir, loperamide, quinidine and digoxin across the confluent monolayer of cells was measured in both directions, apical to basolateral and basolateral to apical. We developed a global optimization algorithm using the Particle Swarm method that can simultaneously fit all datasets to yield accurate and exhaustive fits of these elementary rate constants. The statistical sensitivity of the fitted values was determined by using 24 identical replicate fits, yielding simple averages and standard deviations for all of the kinetic parameters, including the efflux active P-gp surface density. Digoxin required additional basolateral and apical transporters, while loperamide required just a basolateral tranporter. The data were better fit by assuming bidirectional transporters, rather than active importers, suggesting that they are not MRP or active OATP transporters. The P-gp efflux rate constants for quinidine and digoxin were about 3-fold smaller than reported ATP hydrolysis rate constants from P-gp proteoliposomes. This suggests a roughly 3∶1 stoichiometry between ATP hydrolysis and P-gp transport for these two drugs. The fitted values of the elementary rate constants for these P-gp substrates support the hypotheses that the selective pressures on P-gp are to maintain a broad substrate range and to keep xenobiotics out of the cytosol, but not out of the apical membrane.


Conflict of interest statement

Competing Interests: Thuy Tran, Frank Tobin, Feby Abraham and Harma Ellens had or have an affiliation to the commercial funders of this research (GlaxoSmithKline). There are no patents, products in development or marketed products to declare. This does not alter the authors' adherence to all the PLoS ONE policies on sharing data and materials.

Figures

Figure 1
Figure 1. Model of the Confluent Monolayer of Polarized Cells.
Model of a confluent cell monolayer, with the apical membrane on top and the basolateral membrane below, where it binds to the polycarbonate insert. P-gp expressed on the apical membrane transports substrate from the inner apical membrane monolayer into the apical chamber. The concentration of substrate in the apical and basolateral chambers, CA and CB, are measured, while the concentration of substrate in the inner plasma membrane, CPC, and the cytosol, CC, are predicted as part of the mass action modeling and data fitting process. Some compounds use other transporters expressed by the MDCKII-hMDR1 confluent cell monolayer. Passive permeability occurs in both directions.
Figure 2
Figure 2. Amprenavir transport over 6 hours across the MDCKII-hMDR1 cell monolayer.
Amprenavir transport A>B and B>A over 6 hours across the MDCKII-hMDR1 confluent cell monolayer with 100 mM on the donor side initially. The symbols show the data points with error bars showing the standard deviation of triplicate measurements. A∶B>A denotes the substrate concentration in the apical chamber when the basolateral chamber is the donor, while B∶B>A denotes the substrate concentration remaining in the donor basolateral chamber. The A∶B>A transport is high because P-gp actively pumps drug into the receiver apical chamber. The B∶A>B denotes the substrate concentration in the basolateral chamber when the apical chamber is the donor, while A∶A>B denotes the substrate concentration remaining in the donor apical chamber. The B∶A>B transport is low because P-gp actively pumps drug back into the donor apical chamber. The lines show the best fits for amprenavir transport assuming there are no other transporters except P-gp.
Figure 3
Figure 3. Simultaneous fits of P-gp efflux active surface density, T(0), and association rate constant, k1.
24 independent replicate fits of all 72 experimental data from Tran et al. and Acharya et al. , . All 13 kinetic parameters were simultaneously fitted to all relevant datasets. For all figures, the x- and y-axes show the user-fixed lower and upper bounds used in each fitting round. Fig. 3A shows the 1st round of fitting for the drug independent values of the surface density of efflux active P-gp in the apical membrane, T(0), and the association rate constant k1. The open triangles show the 24 individual fitted values. The solid triangle shows the log-average and the error bars are the standard deviation for the 24 individual fits, which are also written onto the figure. The average coefficient of variation over all data sets and the 24 replicate fits, <CV/dataset>, is also shown with its standard deviation. Fig. 3B shows the A∶B>A trajectories of 6 randomly chosen fits from the data for 30 mM digoxin transport, as an example. Four of the trajectories are on-target with the data, one is close and one is off-target. Fig. 3C shows the results for the 2st round of 24 independent replicate fits, which was started as a fresh run with upper and lower bounds shown by the dashed box in Fig. 3A, together with appropriately reduced upper and lower bounds for the drug dependent kinetic parameters. The consensus average values, standard deviations and the ranges are given in Table 1. Fig. 3D shows the A∶B>A trajectories of 6 randomly chosen fits from the 2nd round for 30 mM digoxin transport, like Fig. 3B. All six trajectories are on-target with the data and tighter than found in Fig. 3B for the 1st round, hence the reduced range of fitted values.
Figure 4
Figure 4. 24 independent replicate fits from the 2nd fitting round for drug dependent kinetic parameters.
Fig. 4A shows the fitted values for kr and k2 for each drug. The x- and y-axes show the upper and lower bounds for these fits. Like Fig. 3, the open symbols show the 24 individual fits for amprenavir (AMP, triangles), quinidine (QND, circles) and loperamide (LPM, squares) and digoxin (DGX, x). The closed symbols show the log-average with error bars showing standard deviations. Fig. 4B shows the fitted values for the loperamide basolateral transporter, kB, (LPM, squares) and for the digoxin basolateral and apical transporters, kB and kA, (DGX, x symbols). The closed symbols show the log-average with error bars showing standard deviations. The x- and y-axes show the upper and lower bounds for these parameters. The consensus average values, standard deviations and the ranges are given in Table 1.
Figure 5
Figure 5. Fits of digoxin data with bidirectional or active importers.
Fits of all the digoxin data with the assumption that the basolateral and apical transporters are bidirectional, Fig. 5A , or are active importers, Fig. 5B . The best fits for each mechanism are shown just for the 30 mM digoxin example, which is representative.

References

    1. Endres CJ, Hsiao P, Chung FS, Unadkat JD. The role of transporters in drug interactions. Eur J Pharm Sci. 2006;27:501–517. - PubMed
    1. Shitara Y, Horiea T, Sugiyama Y. Transporters as a determinant of drug clearance and tissue distribution. Eur J Pharm Sci. 2006;27:425–446. - PubMed
    1. Sharom FJ. Drug Transporters: Molecular characterization and role in drug disposition. Hoboken, NJ: John Wiley & Sons, Inc; 2007.
    1. Kannan P, John C, Zoghbi SS, Halldin C, Gottesman MM, et al. Imaging the function of P-glycoprotein with radiotracers: Pharmacokinetics and in vivo applications. Clin Pharmacol Ther. 2009;86:368–377. - PMC - PubMed
    1. Higgins CF, Linton K. The ATP switch model for ATP transporters. Nature Struct & Mol Biol. 2004;11:918–926. - PubMed

Publication types