. 2011;6(10):e26104.
doi: 10.1371/journal.pone.0026104. Epub 2011 Oct 20.

The use of multidimensional image-based analysis to accurately monitor cell growth in 3D bioreactor culture

Affiliations

The use of multidimensional image-based analysis to accurately monitor cell growth in 3D bioreactor culture

Marc-Olivier Baradez et al. PLoS One. 2011.

Abstract

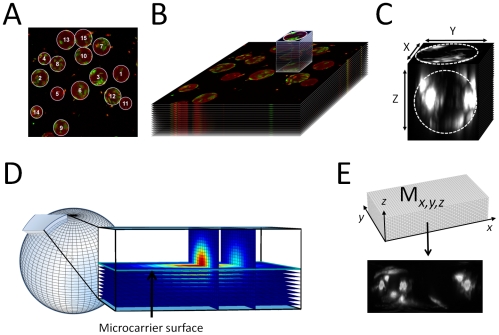
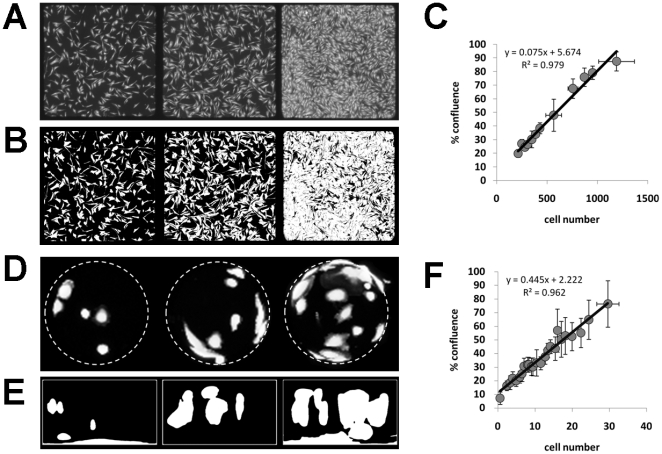
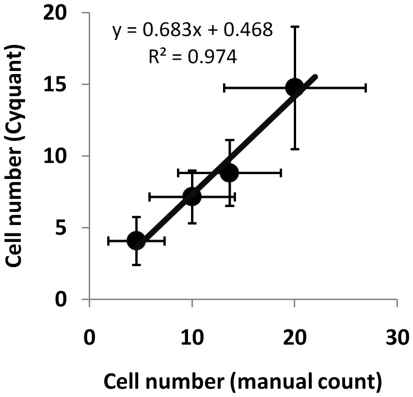
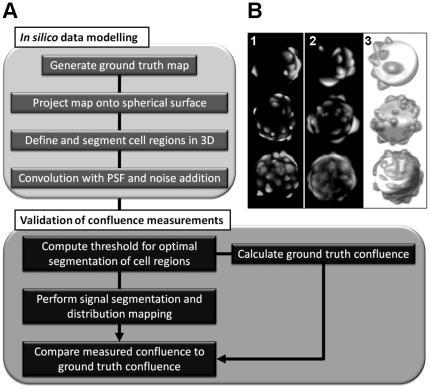
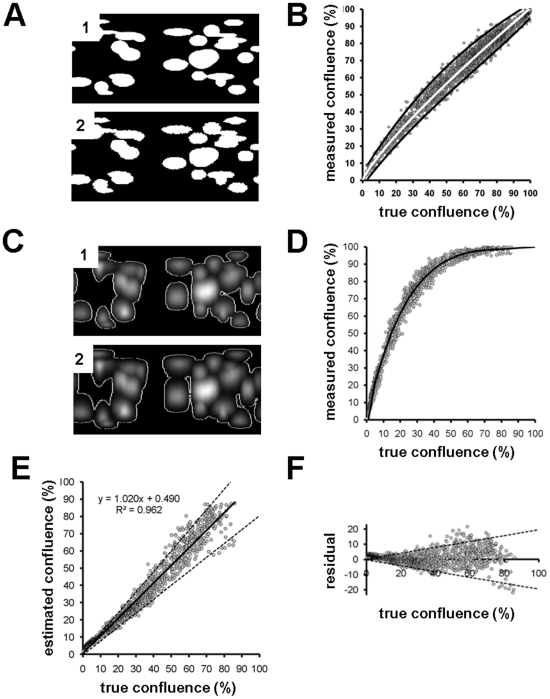
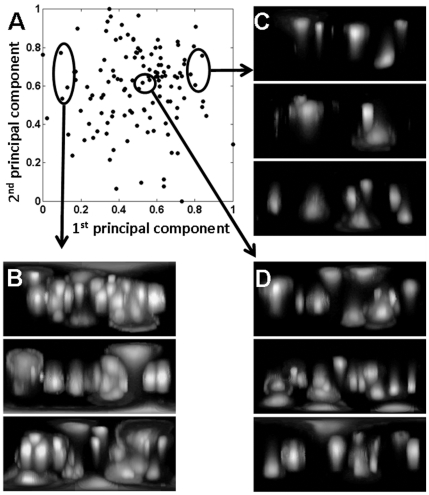
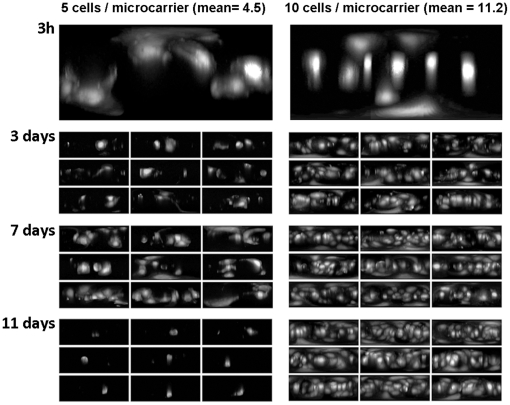
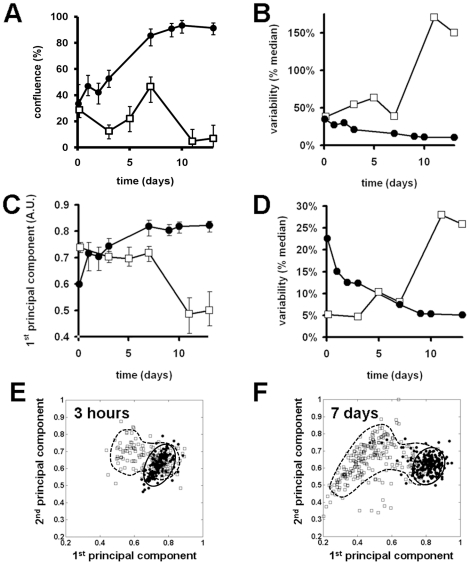
The transition from traditional culture methods towards bioreactor based bioprocessing to produce cells in commercially viable quantities for cell therapy applications requires the development of robust methods to ensure the quality of the cells produced. Standard methods for measuring cell quality parameters such as viability provide only limited information making process monitoring and optimisation difficult. Here we describe a 3D image-based approach to develop cell distribution maps which can be used to simultaneously measure the number, confluency and morphology of cells attached to microcarriers in a stirred tank bioreactor. The accuracy of the cell distribution measurements is validated using in silico modelling of synthetic image datasets and is shown to have an accuracy >90%. Using the cell distribution mapping process and principal component analysis we show how cell growth can be quantitatively monitored over a 13 day bioreactor culture period and how changes to manufacture processes such as initial cell seeding density can significantly influence cell morphology and the rate at which cells are produced. Taken together, these results demonstrate how image-based analysis can be incorporated in cell quality control processes facilitating the transition towards bioreactor based manufacture for clinical grade cells.


Conflict of interest statement

Competing Interests: The authors have read the journal's policy and have the following conflicts: Marc-Olivier Baradez and Damian Marshall are employees of LGC. There are no patents, products in development or marketed products to declare. This does not alter the authors' adherence to all the PLoS ONE policies on sharing data and materials.

Figures

Figure 1
Figure 1. Mapping the distribution of HDF cells on the surface of microcarrier beads.
(A) Maximum intensity projection from confocal image Z-stack with microcarriers identified by Hough transform (circles). (B) Extraction of sub-volume from Z-stack containing 3D fluorescence associated with a single microcarrier. (C) Top and side projection images calculated from sub-volume used to locate X-Y-Z coordinates of microcarrier (dashed circles and arrows). (D) Iterative fluorescence intensity measurements in the vicinity of the microcarrier surface (sphere) using 30 sampling spherical grids (horizontal planes in magnified sampling volume, extended to the whole microcarrier surface). (E) Cell distribution map (bottom) computed from unwrapped stack of sampling grids (top, Mx,y,z).
Figure 2
Figure 2. Comparison of confluency and cell number measurements in 2D and 3D culture.
(A) 2D monolayer culture of fluorescently labelled HDF cells seeded on 2 mm2 gridded slides at three different seeding densities. (B) Cell segmentation of the images using manual thresholding to identify the individual cells. (C) Graph showing the linear relationship between cell confluency and cell number in 2D culture. (D) 3D microcarriers seeded with fluorescently labelled HDF cells at three different densities. Dashed lines show circumference of the microcarrier beads. (E) Segmented cell distribution maps processed using the cell confluency algorithm. (F) Graph showing the linear relationship between cell number and confluency for cells grown on microcarrier beads and analysed using the cell confluency algorithm.
Figure 3
Figure 3. Comparison of cell number measurments.
Graph to the show the linear relationship between cell number measurements obtained using the cell distribution mapping process and the commercial Cyquant assay.
Figure 4
Figure 4. Validation of distribution mapping process with in silico modelling of cells adhered to microcarrier beads.
(A) Flow diagram for in silico modelling (top compartment) and validation of confluence measurement (bottom compartment). (B) 1- Maximum intensity top projection confocal images of real HDF cells adhered to microcarrier beads. 2 – Synthetic maximum intensity top projections of cells distributions around microcarrier beads generated by in silico modelling. 3 – 3D rendering of the synthetic cell distribution in B2 to show cell localisation and comparability to real image data.
Figure 5
Figure 5. Validation of confluency measurements using cell distribution mapping.
(A) 1 - Ground truth synthetic cell distribution map generated in absence of noise or PSF. 2 – cell confluency map generated from the synthetic data using the distribution map image processing algorithm. (B) Comparison of synthetic ground truth confluence versus measured confluence. The ground truth confluence is known before artificial 3D modelling (from A1) whereas the measured confluence is calculated from the map obtained after processing of the 3D model (from A2). White line = power model fit, black lines are 95% confidence intervals. (C) 1 - Optimal thresholding (white lines) of cell distribution map shown in A1 after convolution of the 3D model with PSF and the addition of noise. 2- Cell confluency analysis of image B1 generated using the cell distribution mapping algorithm. (D) Comparison of true confluence (from ground truth data) with confluence measured by the cell distribution mapping algorithm. Over-estimation from the proposed method is evident from the shape of the data distribution. However this bias can be accurately modelled (black curve). (E) True confluence (from ground truth maps) versus measured confluence calculated from D (y axis) and the fitted model (D, black curve). Estimated confluence through bias compensation restores the expected linearity between true and estimated confluences (R 2 = 0.96). Bold and dashed lines represent linear fit ±95% confidence interval. (F) Error estimation by residual analysis. Residual values are obtained by subtracting linear fit values from estimated confluences in E. Dashed lines represent ±95% confidence interval.
Figure 6
Figure 6. Principal Component Analysis (PCA) of the cell distribution maps.
(A) Texture measurements from microcarrier seeded with 10 cells per bead and incubated for 2.5 hours were subjected to PCA and 1st and 2nd principal components were plotted. The PCA scatter plot provides a snapshot graphical representation of the distribution of cell morphologies. (B) Cell distribution maps taken from the left of the PCA space have the highest cell confluency. (C) Distribution maps from the right of the PCA have the lowest cell confluency. (D) The most representative cell distribution maps for the analysis are located in the centre of the PCA space.
Figure 7
Figure 7. Cell distribution maps to visualise changes in cell confluency in response to cell seeding density.
Microcarriers were seeded with either 5 cells per bead (left column) or 10 cells per bead (right column) and the most representative cell distribution maps from the centre of the PCA space were used to visualise difference in cell confluency over an 11 day culture period.
Figure 8
Figure 8. The use of PCA to quantitatively measure cell number, morphology and confluency during cell manufacture.
(A) changes in cell confluency over 11 days in bioreactor culture for HDF cells seeded onto microcarriers at a density of 10 cells per bead (black squares) or 5 cells per bead (open squares). Fitted curves = median values, error bars = 16th–84th percentiles (percentiles are used to accommodate skewed distributions. If the data were Normally distributed, the 16th–84th percentiles would correspond to ± 1SD). (B) Measurement of bead to bead variability in cell confluency during the 11 day manufacture procedure for cells seeded onto microcarriers at a density of 10 cells per bead (black squares) or 5 cells per bead (open squares). (C) Analysis of cell morphology using the 1st PC shows that microcarriers seeded at 10 cells per bead (black squares) maintain a stable morphology compared to microcarrier seeded at 5 cells per bead (open squares). (D) Analysis of the bead to bead variability in cell morphology for microcarrier seeded at 10 cells per bead (black squares) and 5 cells per bead (open squares). (E–F) The use of PCA to show differences in morphological distribution of cells seeded onto microcarrier at 10 cells per bead (black squares) or 5 cells per bead (open squares) after 2.5 hours (E) and 7 days (F) in bioreactor culture.

References

    1. Martin I, Smith T, Wendt D. Bioreactor based roadmap for the translation of tissue engineered strategies into clinical products. Trends Biotechnol. 2009;27:495–502. - PubMed
    1. Han Y, Liu XM, Liu H, Li SC, Wu BC, et al. Cultivation of recombinant Chinese hamster ovary cells grown as suspended aggregates in stirred vessels. J Biosci Bioeng. 2006;102:430–435. - PubMed
    1. King JA, Miller WM. Bioreactor development for stem cell expansion and controlled differentiation. Curr Opin Chem Biol. 2007;11:394–398. - PMC - PubMed
    1. Zandstra PW, Nagy A. Stem cell bioengineering. Annu Rev Biomed Eng. 2001;3:275–305. - PubMed
    1. Serra M, Brito C, Sousa MF, Jensen J, Tostões R, et al. Improving expansion of pluripotent human embryonic stem cells in perfused bioreactors through oxygen control. J Biotechnol. 2010;148:208–215. - PubMed

Publication types