. 2011;6(10):e26254.
doi: 10.1371/journal.pone.0026254. Epub 2011 Oct 18.

Evidence for oxidative stress and defective antioxidant response in guinea pigs with tuberculosis

Affiliations

Evidence for oxidative stress and defective antioxidant response in guinea pigs with tuberculosis

Gopinath S Palanisamy et al. PLoS One. 2011.

Abstract

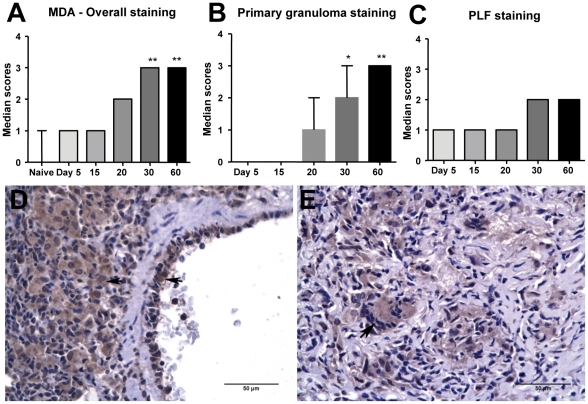
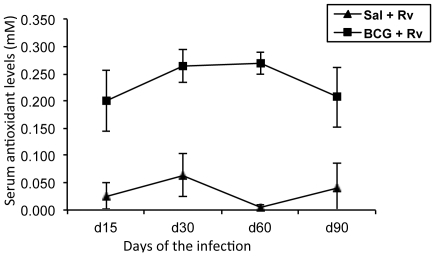
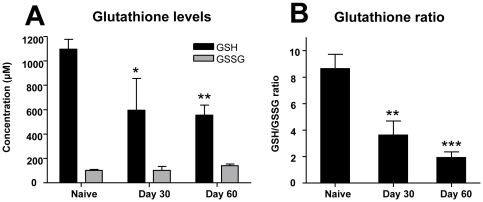
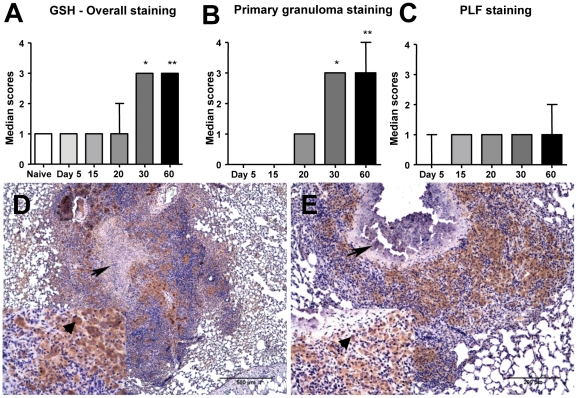
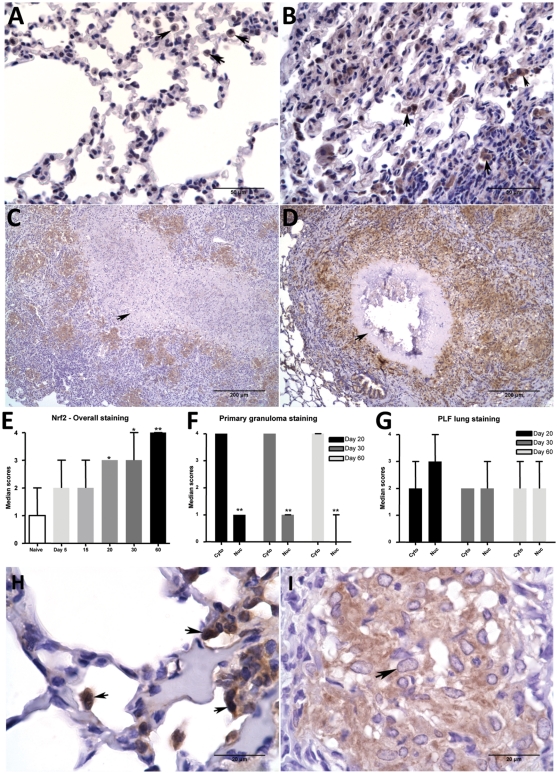
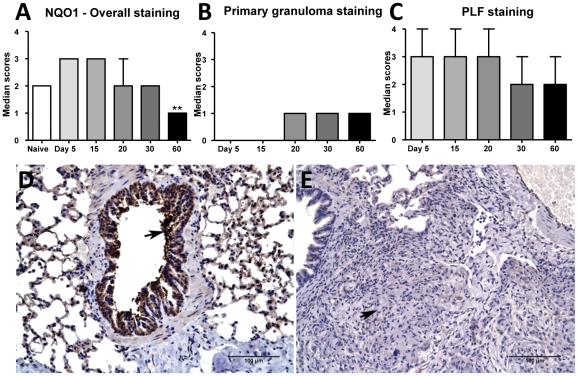
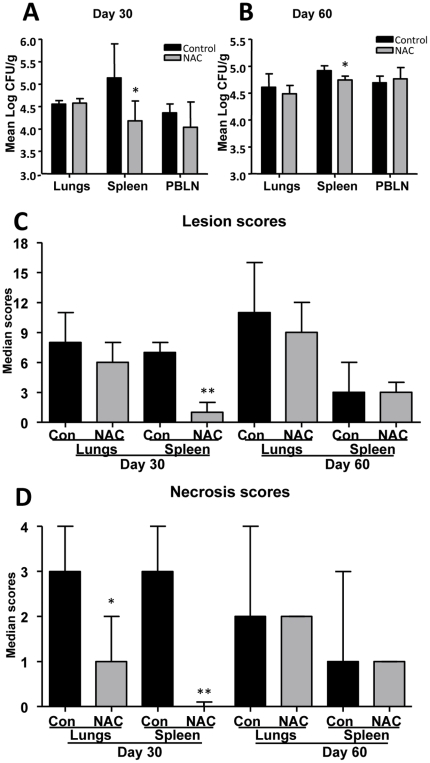
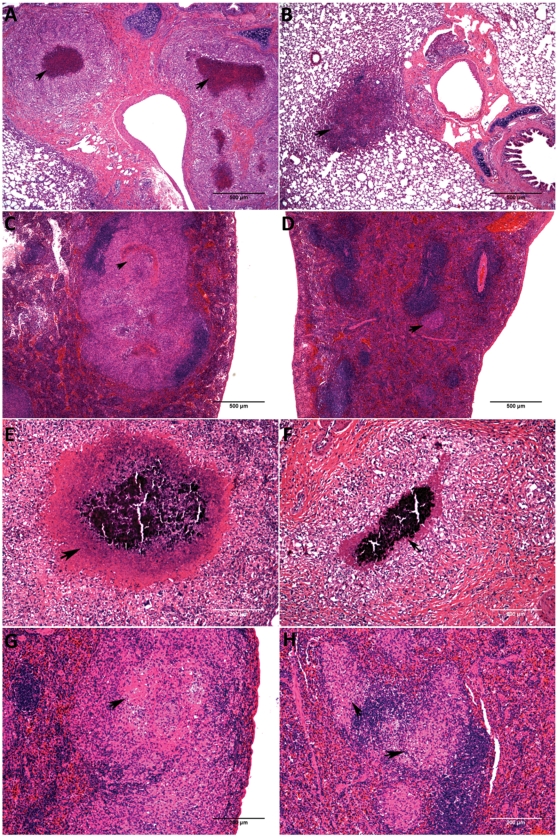
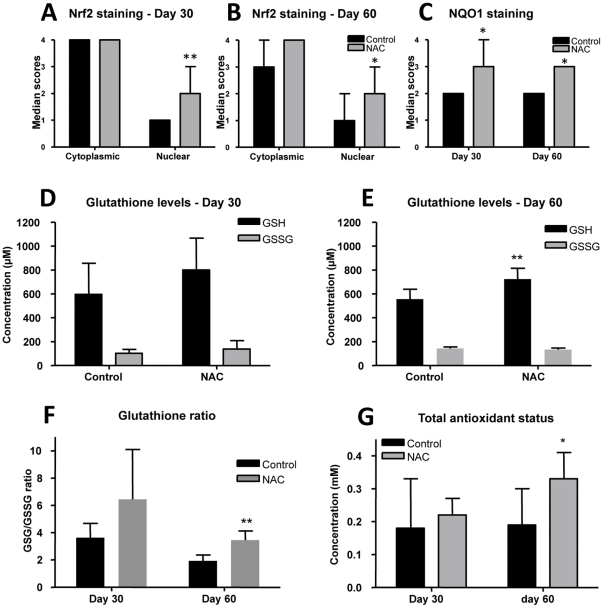
The development of granulomatous inflammation with caseous necrosis is an important but poorly understood manifestation of tuberculosis in humans and some animal models. In this study we measured the byproducts of oxidative stress in granulomatous lesions as well as the systemic antioxidant capacity of BCG vaccinated and non-vaccinated guinea pigs experimentally infected with Mycobacterium tuberculosis. In non-vaccinated guinea pigs, oxidative stress was evident within 2 weeks of infection as measured by a decrease in the serum total antioxidant capacity and blood glutathione levels accompanied by an increase in malondialdehyde, a byproduct of lipid peroxidation, within lesions. Despite a decrease in total and reduced blood glutathione concentrations, there was an increase in lesion glutathione by immunohistochemistry in response to localized oxidative stress. In addition there was an increase in the expression of the host transcription factor nuclear erythroid 2 p45-related factor 2 (Nrf2), which regulates several protein and non-proteins antioxidants, including glutathione. Despite the increase in cytoplasmic expression of Nrf2, immunohistochemical staining revealed a defect in Nrf2 nuclear translocation within granulomatous lesions as well as a decrease in the expression of the Nrf2-regulated antioxidant protein NQO1. Treating M. tuberculosis-infected guinea pigs with the antioxidant drug N-acetyl cysteine (NAC) partially restored blood glutathione concentrations and the serum total antioxidant capacity. Treatment with NAC also decreased spleen bacterial counts, as well as decreased the lung and spleen lesion burden and the severity of lesion necrosis. These data suggest that the progressive oxidative stress during experimental tuberculosis in guinea pigs is due in part to a defect in host antioxidant defenses, which, we show here, can be partially restored with antioxidant treatment. These data suggest that the therapeutic strategies that reduce oxidant-mediated tissue damage may be beneficial as an adjunct therapy in the treatment and prevention of tuberculosis in humans.


Conflict of interest statement

Competing Interests: The authors have declared that no competing interests exist.

Figures

Figure 1
Figure 1. There is increased malondialdehyde accumulation in the lungs of M. tuberculosis infected guinea pigs.
The graphs A, B and C represent MDA immunostaining scores within overall, primary granuloma and primary lesion free (PLF) lung areas respectively at different time points of Mtb H37Rv infection (median+range, n = 5). The stars denote statistically significant increase compared to the naive animals (* = p<0.05 and ** = p<0.01). The photomicrographs D and E represent immunostaining of MDA in Mtb-infected guinea pig lungs from day 30 and day 60 of infection respectively (arrowheads show intracellular staining within macrophages and vascular endothelial cells).
Figure 2
Figure 2. M. tuberculosis infection of guinea pigs results in decreased serum antioxidant capacity.
The graph illustrates systemic mean (± SD) total antioxidant levels in serum of Mtb-infected guinea pigs that are either saline vaccinated (control) or BCG vaccinated (n = 5). The mean total antioxidant level in serum of naïve guinea pigs is 0.211±0.042 mM (n = 5).
Figure 3
Figure 3. Total and reduced blood glutathione levels are decreased during M. tuberculosis infection in guinea pigs.
The graph A denotes the systemic levels of reduced- and oxidized-glutathione (GSH and GSSG respectively) in the blood of naive and Mtb-infected guinea pigs on days 30 and 60 after the infection. The graph B illustrates the ratio between reduced- and oxidized-glutathione in blood from the same animals. Stars represent statistically significant decrease compared to the naive animals (* = p<0.05, ** = p<0.01 and *** = p<0.001).
Figure 4
Figure 4. Glutathione expression is increased in lung lesions of M. tuberculosis-infected guinea pigs.
The graphs A, B and C represent glutathione immunostaining scores (median+range, n = 5) within overall, primary granuloma and primary lesion free (PLF) lung areas respectively at different time points (* = p<0.05 and ** = p<0.01 when compared to the naive animals). Figures D and E illustrate predominant glutathione staining in the primary granulomas (arrows) with necrotic core on day 30 (non-mineralized core) and on day 60 (mineralized core). Inserts show the intracellular staining within the macrophages (200×, arrowheads).
Figure 5
Figure 5. Intracellular Nrf2 expression is increased in lung lesions of M. tuberculosis infected guinea pigs.
The photomicrographs A, B, C and D represent Nrf2 immunostaining within infected lungs from day 0, 20, 30 and 60 respectively. Arrowheads (in A&B) show intracellular staining within macrophages. Arrows (in C & D) show primary granulomas with necrotic core demonstrating Nrf2 staining. The graph E represents Nrf2 overall lung immunostaining scores at different time points of infection. The bars represent median values (+range) for each group (n = 5). The stars denote statistically significant increase compared to the naive animals (* = p<0.05 and ** = p<0.01). The graphs F and G represent median cytoplasmic and nuclear staining scores (+range) at different time points within primary granuloma and PLF lung areas respectively. The photomicrographs H and I represent immunostaining of Nrf2 in PLF lung (arrows show both intracytoplasmic and nuclear staining within macrophages) and primary granuloma (arrowhead shows predominantly intracytoplasmic but no nuclear staining of Nrf2 in macrophages) of a same animal on day 30.
Figure 6
Figure 6. Nrf2-regulated antioxidant protein NQO1 expression is decreased in lung lesions from M. tuberculosis infected guinea pigs.
The graphs A, B and C represent NQO1 immunostaining scores within overall, primary granulomas and primary lesion free (PLF) lung areas respectively at different time points. The bars represent median values (+range) for each group (n = 5). The photomicrographs D and E represent immunostaining of NQO1 in M. tuberculosis -infected guinea pig lungs on day 5 (arrow shows strong immunoreactivity within airway epithelial cells) and day 30 (arrow points to a granuloma with no immunoreactivity) respectively.
Figure 7
Figure 7. Treatment of M. tuberculosis infected guinea pigs with NAC reduces the bacterial burden and extra-pulmonary disease severity.
The graphs A and B represent mean numbers of bacilli in different organs from control and NAC treated guinea pigs on day 30 and 60 respectively (mean+SD, n = 5). The graphs C and D represent overall lesion and necrosis scores (median+range) respectively of lungs and spleen from control and NAC treated animals on days 30 and 60 (n = 5). Statistically significant change, if present, is indicated with stars (** = p<0.01).
Figure 8
Figure 8. Treatment of M. tuberculosis infected guinea pigs with NAC reduces pulmonary and extra-pulmonary granuloma necrosis.
The photomicrographs A, B, C and D represent lesion pathology in the lungs (A & B) and spleen (C & D) on day 30 in control (A & C) and NAC (B & D) treated animals. The arrows in A and C (controls) show a large core of necrosis and the arrowheads in B and C (NAC treated) point to granulomas with minimal to no necrosis. The photomicrographs E, F, G and H represent the lesion burden in the lungs (E & F) and spleen (G & H) on day 60 in control (E & G) and NAC (F & H) treated animals. The arrows in E and G (controls) show a large area of necrosis and the arrowheads in F and H (NAC treated) show the granulomas with smaller area of necrosis.
Figure 9
Figure 9. NAC treatment of M. tuberculosis infected guinea pig partially restores antioxidant capacity.
The graphs A and B represent the cytoplasmic and nuclear Nrf2 staining scores within primary granulomas of animals treated with control or NAC on days 30 and 60 respectively (median+range, n = 5). The graph C represents NQO1 staining within primary granulomas of animals treated with control or NAC on days 30 and 60 (median+range, n = 5). The graphs D and E represent reduced- and oxidized-glutathione levels (GSH and GSSG) in control and NAC treated animals on days 30 and 60 respectively (mean+SD, n = 5). The graph F represents GSH/GSSG ratio in the blood of control or NAC-treated guinea pigs on days 30 and 60. The graph G represents the systemic total antioxidant levels of serum from control and NAC treated guinea pigs on days 30 and 60 (mean+SD, n = 5). The stars denote statistically significant increase in NAC-treated animals compared to the control animals (* = p<0.05 and ** = p<0.01).

References

    1. Frieden TR, Sterling TR, Munsiff SS, Watt CJ, Dye C. Tuberculosis. The Lancet. 2003;362:887–899. - PubMed
    1. WHO. 2010. Global TB control report 2010.
    1. Espinal MA, Raviglione MC. Global Epidemiology of Tuberculosis. In: M MM, editor. Tuberculosis. Berlin: Springer-Verlag; 2003. pp. 33–43.
    1. Canetti G. The Tubercle Bacillus in the Pulmonary Lesion of Man; Histobacteriology and its bearing on the therapy of pulmonary tuberculosis. New York: Springer Publishing Company, Inc; 1955.
    1. Lenaerts AJ, Hoff D, Aly S, Ehlers S, Andries K, et al. Location of persisting mycobacteria in a Guinea pig model of tuberculosis revealed by r207910. Antimicrob Agents Chemother. 2007;51:3338–3345. - PMC - PubMed

Publication types

MeSH terms