. 2011 Sep;15 Suppl 3(Suppl3):S216-23.
doi: 10.4103/2230-8210.84871.

Imaging of the pituitary: Recent advances

Affiliations

Imaging of the pituitary: Recent advances

Vikas Chaudhary et al. Indian J Endocrinol Metab. 2011 Sep.

Abstract

Pituitary lesions, albeit relatively infrequent, can significantly alter the quality of life. This article highlights the role of advanced imaging modalities in evaluating pituitary-hypothalamic axis lesions. Magnetic resonance imaging (MRI) is the examination of choice for evaluating hypothalamic-pituitary-related endocrine diseases. Advanced MR techniques discussed in this article include dynamic contrast-enhanced MRI, 3T MRI, magnetization transfer (MT) imaging, diffusion-weighted imaging (DWI), proton MR spectroscopy, fluorine-18 fluorodeoxyglucose-positron emission tomography, single-photon emission computed tomography, intraoperative MRI, and intraoperative real-time ultrasonography.

Keywords: Computed tomography; imaging; magnetic resonance imaging; pituitary; recent advances.


Conflict of interest statement

Conflict of Interest: None declared.

Figures

Figure 1
Figure 1
Pituitary microadenoma. Coronal fluid attenuated inversion recovery (a) and routine T1-weighted postcontrast (b) images of brain show a small nodular lesion (thin white arrow) involving the right side of the pituitary gland producing mild bulge of superior margin of the gland and leftward deviation of the pituitary stalk (thick white arrow). The lesion appears isointense to the gland on the fluid attenuated inversion recovery image and shows an enhancement pattern almost identical to the normal pituitary gland
Figure 2
Figure 2
Pituitary microadenoma. High-resolution dynamic contrast-enhanced T1-weighted coronal image of brain of another patient (at 60 seconds) shows a small nonenhancing (dark) microadenoma (thin black arrow) lateralized to the right side of the pituitary gland. Note that the lesion is more conspicuous on dynamic contrast scan compared to the routine contrast scan (seen in figure 5b). The normal pituitary gland shows marked homogenous enhancement and there is no deviation of pituitary stalk (thin white arrow) in this case
Figure 3
Figure 3
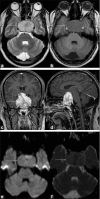
Pituitary macroadenoma with soft consistency. Axial T1W (a) and T2W (b) images show a large inhomogeneous, T1- and T2W isointense pituitary mass (arrow), encroaching bilateral cavernous sinus regions. On postcontrast coronal (c) and sagittal (d) images, the lesion exhibits moderate contrast enhancement. Left internal carotid artery (the cavernous part) appears to be displaced laterally by the mass, while the right internal carotid artery is seen traversing through the mass, which also shows invasion of ipsilateral cavernous sinus. However, both the arteries demonstrate normal contrast opacification with mild luminal compromise. On diffusion-weighted image (e) the lesion is hyperintense to the brain and has a low ADC value compared to normal brain parenchyma, (0.566 ± 0.109)×10-3 mm2/sec on apparent diffusion coefficient mapping (f)
Figure 4
Figure 4
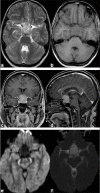
Pituitary macroadenoma with intermediate consistency. Axial T1W (a) and T2W (b) images show a large inhomogeneous, T1-hypointense and T2-hyperintense pituitary mass (arrow), which causes a lateral displacement of bilateral internal carotid arteries (cavernous part). On postcontrast coronal (c) and sagittal (d) images, the lesion exhibits marked but heterogeneous contrast enhancement. On the diffusion-weighted image (e) the lesion is isointense to the brain with an ADC value similar to that of normal brain parenchyma, (0.872 ± 0.138)×10-3 mm2/sec on apparent diffusion coefficient mapping (f)
Figure 5
Figure 5
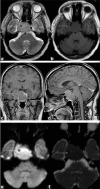
Pituitary macroadenoma with hard consistency. Axial T1W (a) and T2W (b) images demonstrat a large inhomogeneous, T1-hypointense, T2- hyperintense pituitary mass (arrow), which shows marked enhancement on postcontrast coronal (c) and sagittal (d) images. On the diffusion-weighted image (e) the lesion is profoundly hypointense to the brain and shows a high apparent diffusion coefficient value (1.412 ± 0.125)×10-3 mm2/sec on corresponding apparent diffusion coefficient mapping (f)
Figure 6
Figure 6
Pituitary macroadenoma with hemorrhage. Axial T1W (a) and T2W (b) images reveal a pituitary mass (arrow) showing intratumoral hemorrhage. On postcontrast coronal (c) and sagittal (d) images, the lesion demonstrates mild enhancement with left cavernous sinus invasion. Proton MR spectroscopy shows prominence of lipid-lactate peak with reduction of all other metabolites

References

    1. Elster AD. Imaging of the sella: Anatomy and pathology. Semin Ultrasound CT MR. 1993;14:182–94. - PubMed
    1. Carpenter MC. 2nd ed. Baltimore, MD: Williams and Wilkins; 1978. Core text of neuroanatomy; pp. 216–35.
    1. Johnsen DE, Woodruff WW, Allen IS, Cera PJ, Funkhouser GR, Coleman LL. MR imaging of the sellar and juxtasellar regions. Radiographics. 1991;11:727–58. - PubMed
    1. Schwartzberg DG. Imaging of pituitary gland tumors. Semin Ultrasound CT MR. 1992;13:207–23. - PubMed
    1. Crenshaw WB, Chew FS. Rathke's cleft cyst. AJR Am J Roentgenol. 1993;158:1312. - PubMed