. 2011 Oct;16(10):106006.
doi: 10.1117/1.3638180.

Paranodal myelin retraction in relapsing experimental autoimmune encephalomyelitis visualized by coherent anti-Stokes Raman scattering microscopy

Affiliations

Paranodal myelin retraction in relapsing experimental autoimmune encephalomyelitis visualized by coherent anti-Stokes Raman scattering microscopy

Yan Fu et al. J Biomed Opt. 2011 Oct.

Abstract

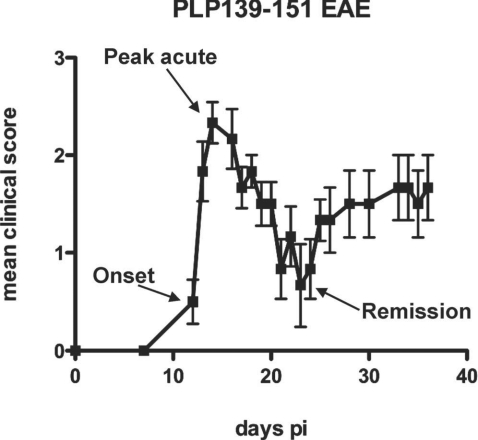
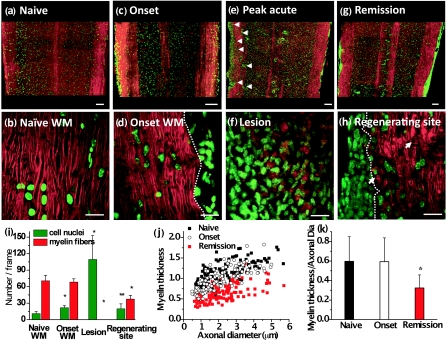
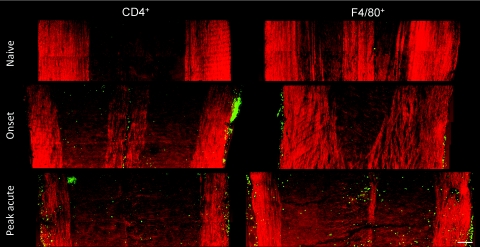
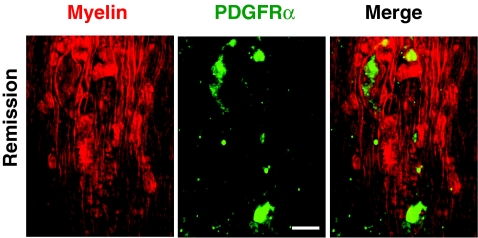
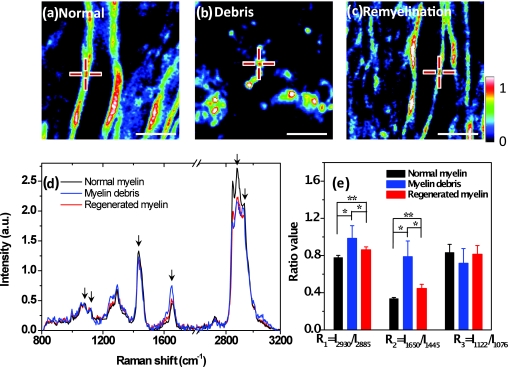
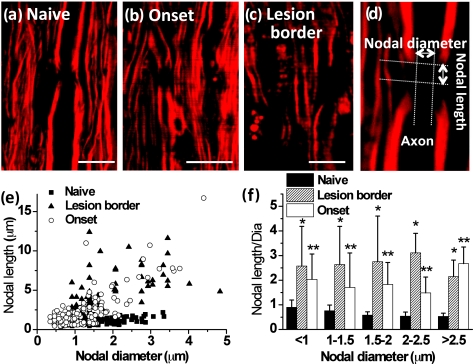
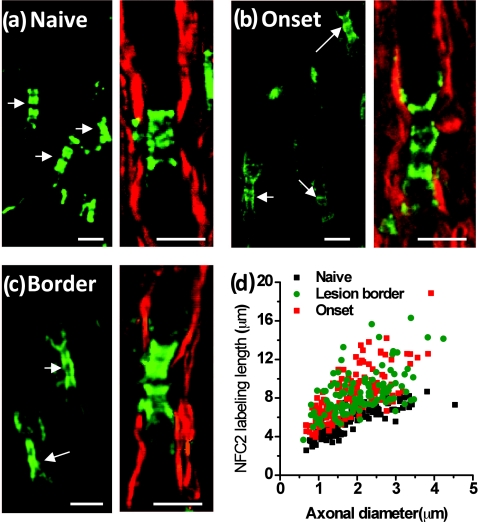
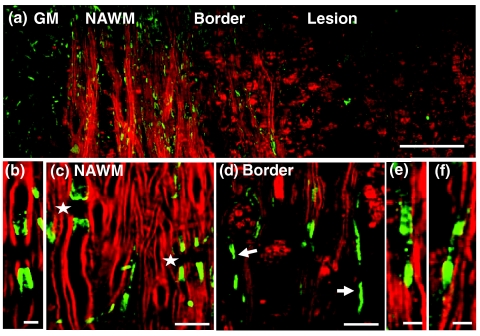
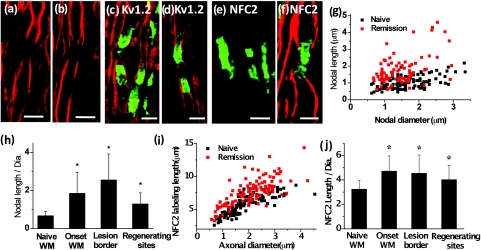
How demyelination is initiated is a standing question for pathology of multiple sclerosis. By label-free coherent anti-Stokes Raman scattering (CARS) imaging of myelin lipids, we investigate myelin integrity in the lumbar spinal cord tissue isolated from naïve SJL mice, and from mice at the onset, peak acute, and remission stages of relapsing experimental autoimmune encephalomyelitis (EAE). Progressive demyelinating disease is initially characterized by the retraction of paranodal myelin both at the onset of disease and at the borders of acute demyelinating lesions. Myelin retraction is confirmed by elongated distribution of neurofascin proteins visualized by immunofluorescence. The disruption of paranodal myelin subsequently exposes Kv1.2 channels at the juxtaparanodes and lead to the displacement of Kv1.2 channels to the paranodal and nodal domains. Paranodal myelin is partially restored during disease remission, indicating spontaneous myelin regeneration. These findings suggest that paranodal domain injury precedes formation of internodal demyelinating lesions in relapsing EAE. Our results also demonstrate that CARS microscopy is an effective readout of myelin disease burden.


Figures

Figure 1
Figure 1
Typical time course of clinical scores for R-EAE mice. The mice at the onset of disease (score of 1 following a period of no clinical symptom after time of immunization), the peak acute (score of 3), and the remission stage (score of 1 following the peak acute), indicated by arrows, were used for the CARS imaging study.
Figure 2
Figure 2
Multimodal imaging of de- and remyelination in R-EAE. Red: myelin imaged by CARS microscopy; Green: Hoechst-labeled cell nuclei imaged by TPEF. (a) A mosaic image shows a large view of a lumbar spinal cord slice from a naïve mouse. (b) A magnified image displays parallel myelinated fibers and regularly organized cellular nuclei in the naive white matter. (c) A mosaic image shows a large view of a lumbar spinal cord slice from a R-EAE mouse at disease onset. (d) Parallel myelin fibers adjacent to the infiltrated cells at R-EAE onset. (e) A mosaic image shows a large view of a lumbar spinal cord slice at the peak acute stage of R-EAE. Demyelinating lesions are indicated by arrow heads. (f) Clusters of cells and myelin debris in a demyelinating lesion. (g) A mosaic image shows a large view of a lumbar spinal cord slice at the remission stage of R-EAE. Numerous cells are restricted in the meninges of the spinal cord and around blood vessels. (h) Remyelinated fibers in a regenerating site (on the right of the dotted line). The arrows indicate the presence of myelin vesicles. (i) Comparison of myelinated fiber number and cell number per frame of image in the naïve white matter, EAE onset white matter, acute demyelinating lesions, and regenerating sites. The frame size is 0.014 mm2. *p < 0.001, **p < 0.05 in comparison to cell nuclei and myelin fibers in the naïve white matter, respectively. (j,k) Comparison of myelin thickness versus axonal diameter at the naïve white matter, white matter at disease onset, and remyelinated fibers at the remission stage. *p < 0.001 in comparison to the naïve white matter. In (a), (c), (e), and (g), bar = 100 μm; in (b), (d), (f), and (h), bar = 20 μm.
Figure 3
Figure 3
Mosaic images showing large-view distribution of CD4+ and F4/80+ cells at the lumbar spinal tissues of a naïve mouse, EAE mice at the onset, and peak acute. Bar = 100 μm.
Figure 4
Figure 4
Presence of oligodendrocyte precursor cells at the remission stage of R-EAE. Red: myelin imaged by CARS; green: immunolabeled PDGFRα imaged by TPEF. Bar = 10 μm.
Figure 5
Figure 5
Confocal Raman spectral analysis of myelin lipid conformation. (a–c) Typical CARS images of normal myelin, myelin debris, and regenerated myelin from lumbar spinal tissues in naïve, peak acute, and remission stages, respectively. The centers of the crosses indicate the positions where Raman spectra are recorded. Bar = 5 μm. (d) Confocal Raman spectra normalized by integral of area under the curves. The peaks at 1076, 1122, 1445, 1650, 2885, and 2930 cm−1 from left to right are indicated by black arrows. (e) Histogram comparing the ratios of intensity between different peaks. *p < 0.005; **p < 0.05.
Figure 6
Figure 6
Paranodal myelin disruption at onset of EAE and within borders of demyelinating lesions. (a–c) Typical CARS images of myelinated nodes in the white matter of a naïve mouse, EAE mice at disease onset, and within borders of demyelinating lesions at the peak acute EAE. A node of Ranvier was observed as a small gap between two segments of compact myelin sheaths in the naïve white matter. Elongated exposure of nodes was observed at locations no more than 100 μm away from the meninges in disease onset and within borders of demyelinating lesions at the peak acute stage. The lesion border was defined as the area extending no more than 100 μm from the locations where the myelin fiber started to appear. The lesions were characterized by myelin debris. (d) Diagram showing the measurement of nodal length and diameter. (e) Nodal lengths versus nodal diameters for myelin at three stages corresponding to (a–c). (f) Comparison of ratios of nodal lengths to nodal diameters at three stages in different nodal diameters. Both *p < 0.001 and **p < 0.001 are compared to the ratio in the naïve mice from the same range of nodal diameter. Bar = 10 μm.
Figure 7
Figure 7
Elongated neurofascin distribution in the paranodal domain. Green: immunolabeled NFC2 imaged by TPEF; red: myelin imaged by CARS. (a–c) Representative images of labeled NFC2 representing neurofascin 155 at the paranodal myelin and neurofascin 186 at the nodal axolemma in the white matter of naïve, EAE onset, and lesion borders at peak acute EAE. Elongated distribution of NFC2 was observed with extension into the internodes at locations no more than 100 μm away from the meninges at EAE onset and within lesion borders at peak acute EAE. (d) Comparison of NFC2 labeling lengths versus axonal diameters at different stages. Bar = 5 μm.
Figure 8
Figure 8
Exposure and displacement of juxtaparanodal Kv1.2 channels. Red: myelin imaged by CARS; green: immunolabeled Kv1.2 channels imaged by TPEF. (a) Mosaic image showing a large view of Kv1.2 labeling and myelin in a lumbar spinal slice at the peak acute EAE. (b) A typical image of paired Kv1.2 channels in the naive white matter that are located at the juxtaparanodes and concealed beneath the compact myelin. (c) NAWM at the peak acute EAE showing paired Kv1.2 labeling (stars) under the myelin cover. (d, e) Exposed Kv1.2 channels [arrows in (d)] and displacement of Kv1.2 channels into the paranodes and nodes at the border of demyelinating lesions. In the lesions where myelin debris was present, no paired Kv1.2 channels were observed. (f) Exposure and displacement of Kv1.2 channels in the white matter of EAE onset. Bar = 50 μm in (a); bar = 5 μm in (b, e, f); bar = 10 μm in (c, d).
Figure 9
Figure 9
Paranodal myelin is partially restored at remission stage. (a,b) CARS images of paranodal myelin in the regenerating sites at the remission stage. Retracted paranodal myelin (a) and split paranodal myelin (b) were observed. (c, d) Overlaid TPEF image of Kv1.2 channels (green) and CARS image of myelin (red) in the regenerating sites. Normal Kv1.2 channel pair (c) and displacement of Kv1.2 channels into the paranodes and nodes (d) were observed. (e) TPEF image of NFC2 labels in a regenerating site. (f) Overlaid TPEF image of NFC2 labels and CARS image of myelin in a regenerating site. The NFC2 labels were normally embedded into two segments of thinner myelin. (g) Comparison of nodal lengths versus nodal diameters based on the CARS images of paranodal myelin. (h) Comparison of ratios of nodal length to nodal diameter at different stages of EAE. (i) NFC2 labeling lengths at the regenerating sites versus naïve white matter. (j) Comparison of NFC2 lengths at different stages of EAE. In (h, j), *p < 0.001 compared to those in the naïve white matter. Bar = 5 μm.

References

    1. Poliak S. and Peles E., “The local differentiation of myelinated axons at nodes of Ranvier,” Nat. Rev. Neurosci. 4, 968–980 (2003).10.1038/nrn1253 - DOI - PubMed
    1. Black J. A., Kocsis J. D., and Waxman S. G., “Ion channel organization of the myelinated fiber,” Trends Neurosci. 13, 48–54 (1990).10.1016/0166-2236(90)90068-L - DOI - PubMed
    1. Tait S., Gunn-Moore F., Collinson J. M., Huang J., Lubetzki C., Pedraza L., Sherman D. L., Colman D. R., and Brophy P. J., “An oligodendrocyte cell adhesion molecule at the site of assembly of the paranodal axo-glial junction,” J. Cell Biol. 150, 657–666 (2000).10.1083/jcb.150.3.657 - DOI - PMC - PubMed
    1. Charles P., Tait S., Faivre-Sarrailh C., Barbin G., Gunn-Moore F., Denisenko-Nehrbass N., Guennoc A., Girault J., Brophy P. J., and Lubetzki C., “Neurofascin is a glial receptor for the paranodin/Caspr-contactin axonal complex at the axoglial junction,” Curr. Biol. 12, 217–220 (2002).10.1016/S0960-9822(01)00680-7 - DOI - PubMed
    1. Van Wart A., Boiko T., Trimmer J. S., and Matthews G., “Novel clustering of sodium channel Nav 1.1 with ankyrin-G and neurofascin at discrete sites in the inner plexiform layer of the retina,” Mol. Cell. Neurosci. 28, 661–673 (2005).10.1016/j.mcn.2004.11.012 - DOI - PubMed

Publication types

MeSH terms