. 2011 Oct 27;365(17):1567-75.
doi: 10.1056/NEJMoa1106955.

Small-airway obstruction and emphysema in chronic obstructive pulmonary disease

Affiliations

Small-airway obstruction and emphysema in chronic obstructive pulmonary disease

John E McDonough et al. N Engl J Med. .

Abstract

Background: The major sites of obstruction in chronic obstructive pulmonary disease (COPD) are small airways (<2 mm in diameter). We wanted to determine whether there was a relationship between small-airway obstruction and emphysematous destruction in COPD.

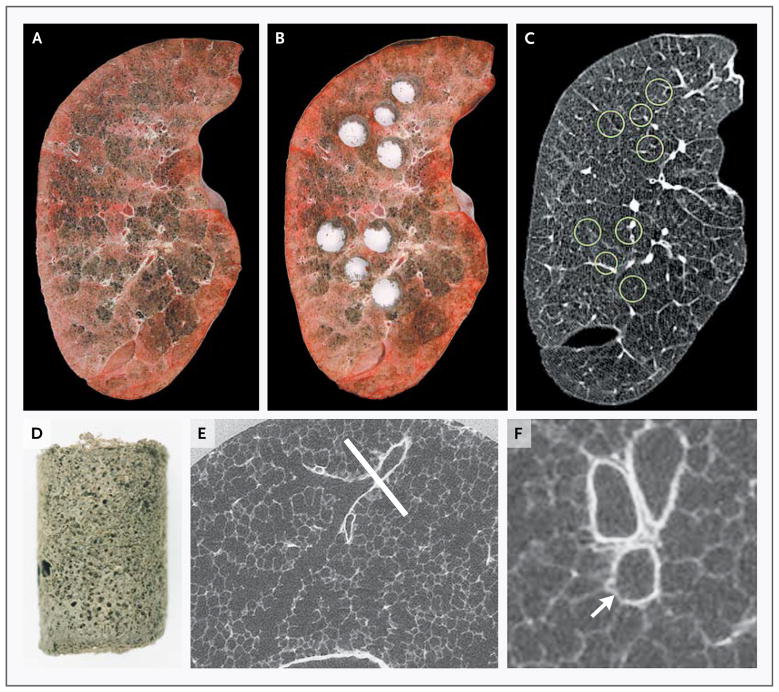
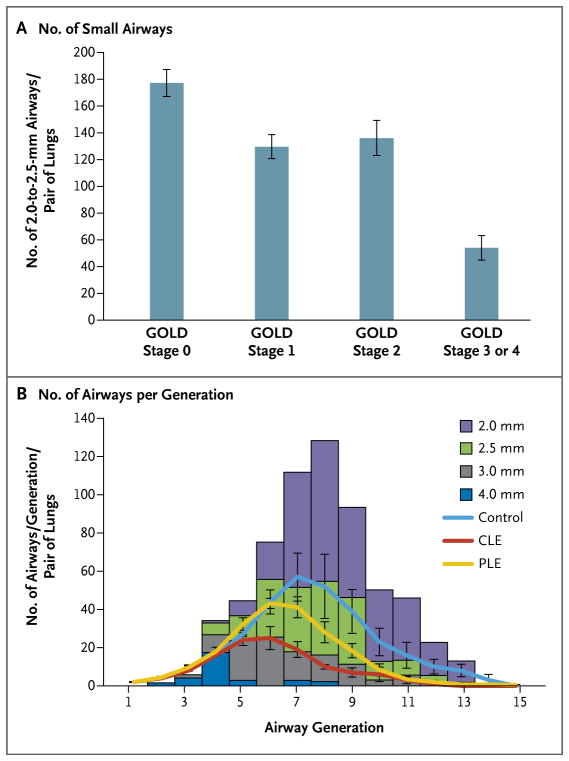
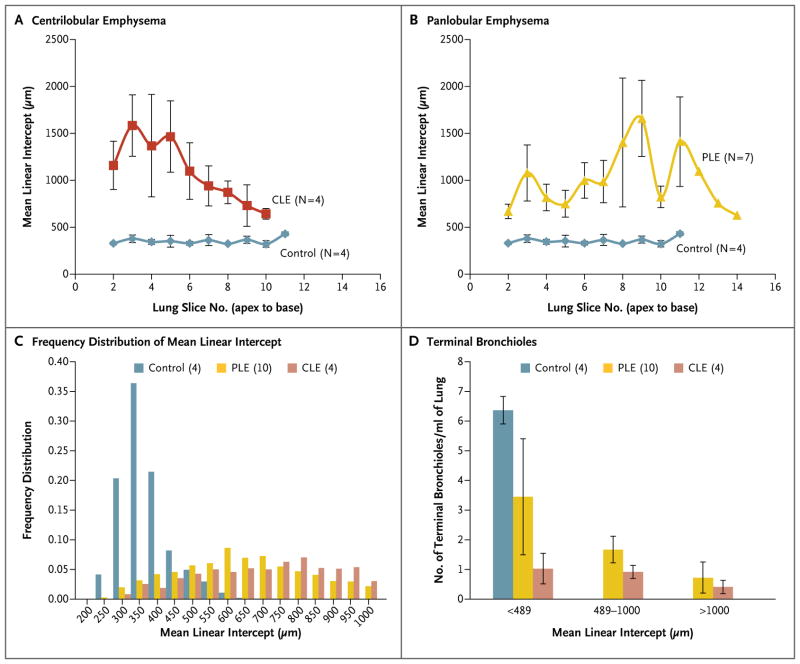
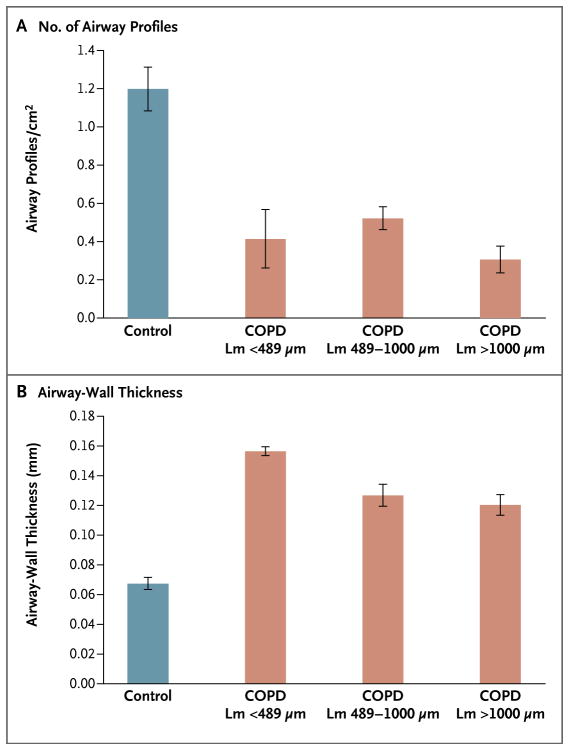
Methods: We used multidetector computed tomography (CT) to compare the number of airways measuring 2.0 to 2.5 mm in 78 patients who had various stages of COPD, as judged by scoring on the Global Initiative for Chronic Obstructive Lung Disease (GOLD) scale, in isolated lungs removed from patients with COPD who underwent lung transplantation, and in donor (control) lungs. MicroCT was used to measure the extent of emphysema (mean linear intercept), the number of terminal bronchioles per milliliter of lung volume, and the minimum diameters and cross-sectional areas of terminal bronchioles.

Results: On multidetector CT, in samples from patients with COPD, as compared with control samples, the number of airways measuring 2.0 to 2.5 mm in diameter was reduced in patients with GOLD stage 1 disease (P=0.001), GOLD stage 2 disease (P=0.02), and GOLD stage 3 or 4 disease (P<0.001). MicroCT of isolated samples of lungs removed from patients with GOLD stage 4 disease showed a reduction of 81 to 99.7% in the total cross-sectional area of terminal bronchioles and a reduction of 72 to 89% in the number of terminal bronchioles (P<0.001). A comparison of the number of terminal bronchioles and dimensions at different levels of emphysematous destruction (i.e., an increasing value for the mean linear intercept) showed that the narrowing and loss of terminal bronchioles preceded emphysematous destruction in COPD (P<0.001).

Conclusions: These results show that narrowing and disappearance of small conducting airways before the onset of emphysematous destruction can explain the increased peripheral airway resistance reported in COPD. (Funded by the National Heart, Lung, and Blood Institute and others.).


Figures

Figure 1
Figure 1. Lung-Tissue Samples Matched with CT Images
Panel A shows a frozen lung slice from a patient with severe centrilobular emphysema, and Panel B shows the same lung slice after samples were removed for analysis. Panel C shows the matching slice from the multidetector CT scan of the intact lung specimen, with the location of samples indicated by circles. Panel D shows a single control lung sample after it was processed for microCT. Panel E shows a microCT image of a control lung at a resolution of 16.24 μm, with a terminal bronchiole (indicated by the white line) at the point at which it branches into respiratory bronchioles. Panel F shows the same terminal bronchiole reoriented to show the cross section of the airway (arrow) at the plane of the section indicated by the line in Panel E.
Figure 2
Figure 2. Numbers of Small Airways and Airways per Generation of Branching, According to the Severity of COPD
Panel A shows the number of airways measuring 2.0 to 2.5 mm in diameter per lung pair that were obtained with the use of a computed tomographic (CT) Disector method to analyze the multidetector CT scans from 78 patients who had various stages of COPD. As compared with the control group, there was a reduced number of small airways per lung pair in patients with stage 1 disease on the Global Initiative for Chronic Obstructive Lung Disease (GOLD) scale (P = 0.001), GOLD stage 2 disease (P = 0.02), and GOLD stage 3 or 4 disease (P<0.001). Panel B shows data obtained by reconstructing the bronchial tree from multidetector CT images of explanted lung specimens. The height of the columns represents the number of airways in each generation (the point at which one airway branches into two or more smaller airways), colored according to the size that was previously reported from lung casts. The number of airways per generation that were obtained in this study shows that control lungs closely match the distribution of airways down to and including those measuring 2.5 mm in diameter. In contrast, in lungs from four patients with centrilobular emphysema (CLE), the number of airways at each generation is lower than predicted, and airways measuring 2.5 mm in diameter or less are largely missing or narrowed to the point of being below the resolution of the multidetector CT scan, with lungs from four patients with panlobular emphysema (PLE) falling between values for those with CLE and for four control lungs. The I bars indicate standard errors.
Figure 3
Figure 3. Mean Linear Intercept and Number of Terminal Bronchioles, According to the Emphysematous Phenotype of COPD
Measurements of the mean linear intercept show the expected distribution of emphysema from lung apex to base in lungs from 4 patients with centrilobular emphysema (CLE) (Panel A) and 7 patients with panlobular emphysema (PLE) (Panel B), with no change as a function of lung-slice number in the 4 control lungs. In Panel C, the frequency distribution of measurements of the mean linear intercept is shown in the 4 control lungs, as compared with the frequency distribution in the 4 lungs affected by CLE and 10 lungs affected by PLE. In Panel D, the regions of the diseased lungs in which the mean linear intercept remained below the upper limit of the 95% confidence interval for the control lungs (<489 μm) have a reduced number of terminal bronchioles per milliliter of lung volume in the CLE group (P<0.001) and remain low in samples with a mean linear intercept of 489 to 1000 μm and of more than 1000 μm. The I bars indicate standard errors.
Figure 4
Figure 4. Airway Profiles and Airway-Wall Thickness, According to the Extent of Emphysema in COPD
Shown are the number of small-airway profiles per square centimeter (Panel A) and the thickness of the airway walls (Panel B), as measured from histologic sections cut from samples of tissue adjacent to those examined on microCT. The number of small-airway profiles per unit area is sharply reduced in regions of diseased lungs in which the mean linear intercept (Lm) remains below the 95% confidence interval (489 μm) observed in control lungs and the surviving airways have thickened walls. The I bars indicate standard errors.

Comment in

References

    1. Hogg JC, Macklem PT, Thurlbeck WM. Site and nature of airway obstruction in chronic obstructive lung disease. N Engl J Med. 1968;278:1355–60. - PubMed
    1. Van Brabandt H, Cauberghs M, Verbeken E, Moerman P, Lauweryns JM, Van de Woestijne KP. Partitioning of pulmonary impedance in excised human and canine lungs. J Appl Physiol. 1983;55:1733–42. - PubMed
    1. Yanai M, Sekizawa K, Ohrui T, Sasaki H, Takishima T. Site of airway obstruction in pulmonary disease: direct measurement of intrabronchial pressure. J Appl Physiol. 1992;72:1016–23. - PubMed
    1. Pedley TJ, Schroter RC, Sudlow MF. The prediction of pressure drop and variation of resistance within the human bronchial airways. Respir Physiol. 1970;9:387–405. - PubMed
    1. Diaz AA, Valim C, Yamashiro T, et al. Airway count and emphysema assessed by chest CT imaging predicts clinical outcome in smokers. Chest. 2010;138:880–7. - PMC - PubMed

Publication types

MeSH terms