

In glucose-limited continuous culture the minimum substrate concentration for growth, Smin, is crucial in the competition between the enterobacterium Escherichia coli and Chelatobacter heintzii, an environmentally abundant bacterium
- PMID: 22030672
- PMCID: PMC3309354
- DOI: 10.1038/ismej.2011.143
In glucose-limited continuous culture the minimum substrate concentration for growth, Smin, is crucial in the competition between the enterobacterium Escherichia coli and Chelatobacter heintzii, an environmentally abundant bacterium
Abstract
The competition for glucose between Escherichia coli ML30, a typical copiotrophic enterobacterium and Chelatobacter heintzii ATCC29600, an environmentally successful strain, was studied in a carbon-limited culture at low dilution rates. First, as a base for modelling, the kinetic parameters μ(max) and K(s) were determined for growth with glucose. For both strains, μ(max) was determined in batch culture after different precultivation conditions. In the case of C. heintzii, μ(max) was virtually independent of precultivation conditions. When inoculated into a glucose-excess batch culture medium from a glucose-limited chemostat run at a dilution rate of 0.075 h(-1) C. heintzii grew immediately with a μ(max) of 0.17 ± 0.03 h(-1). After five transfers in batch culture, μ(max) had increased only slightly to 0.18 ± 0.03 h(-1). A different pattern was observed in the case of E. coli. Inoculated from a glucose-limited chemostat at D = 0.075 h(-1) into glucose-excess batch medium E. coli grew only after an acceleration phase of ~3.5 h with a μ(max) of 0.52 h(-1). After 120 generations and several transfers into fresh medium, μ(max) had increased to 0.80 ± 0.03 h(-1). For long-term adapted chemostat-cultivated cells, a K(s) for glucose of 15 μg l(-1) for C. heintzii, and of 35 μg l(-1) for E. coli, respectively, was determined in (14)C-labelled glucose uptake experiments. In competition experiments, the population dynamics of the mixed culture was determined using specific surface antibodies against C. heintzii and a specific 16S rRNA probe for E. coli. C. heintzii outcompeted E. coli in glucose-limited continuous culture at the low dilution rates of 0.05 and 0.075 h(-1). Using the determined pure culture parameter values for K(s) and μ(max), it was only possible to simulate the population dynamics during competition with an extended form of the Monod model, which includes a finite substrate concentration at zero growth rate (s(min)). The values estimated for s(min) were dependent on growth rate; at D = 0.05 h(-1), it was 12.6 and 0 μg l(-1) for E. coli and C. heintzii, respectively. To fit the data at D=0.075 h(-1), s(min) for E. coli had to be raised to 34.9 μg l(-1) whereas s(min) for C. heintzii remained zero. The results of the mathematical simulation suggest that it is not so much the higher K(s) value, which is responsible for the unsuccessful competition of E. coli at low residual glucose concentration, but rather the existence of a significant s(min).
Figures
 ) and wash-out (
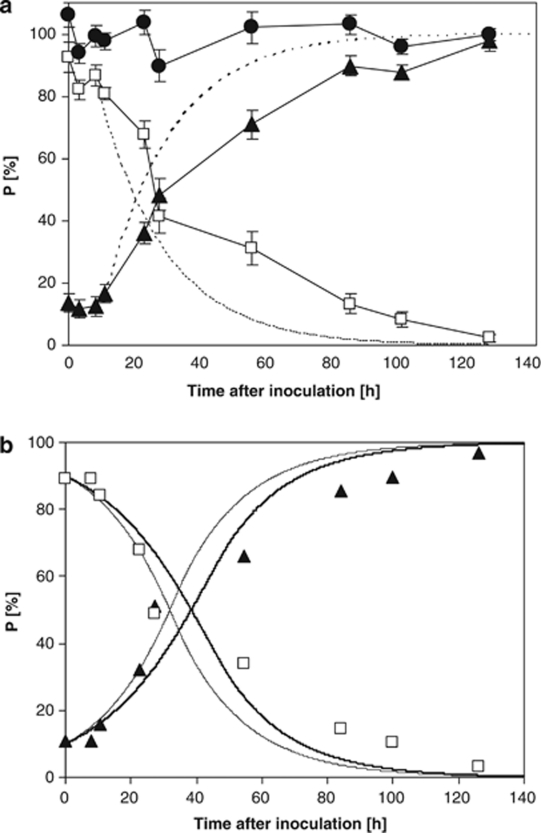
 ) curves are shown assuming a lag phase of 8 h. (b) Prediction of competition for glucose for a mixed culture of E. coli (□) and C. heintzii (▴) in a glucose-limited continuous culture at a dilution rate of 0.05 h−1 using the fits for the different smin are shown, namely for smin=18.0 μg l−1 (
 ) from Kovárová et al. (1996) and for smin=12.6 μg l−1 (
 ), a value obtained by parameter estimation.
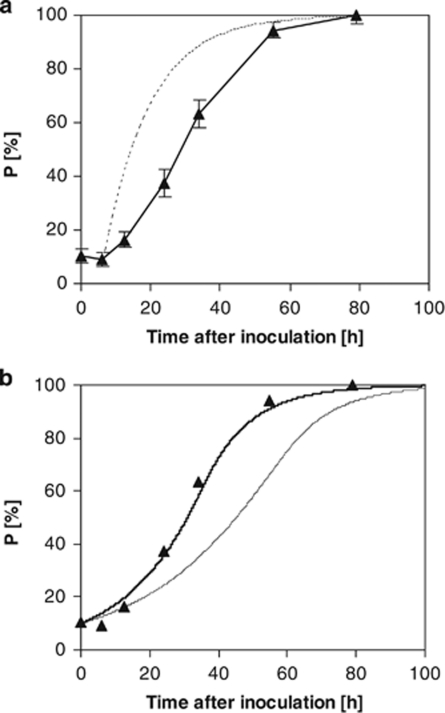
 ) from Kovárová et al. (1996) and for smin=34.9 μg l−1 (—), a value obtained by parameter estimation.
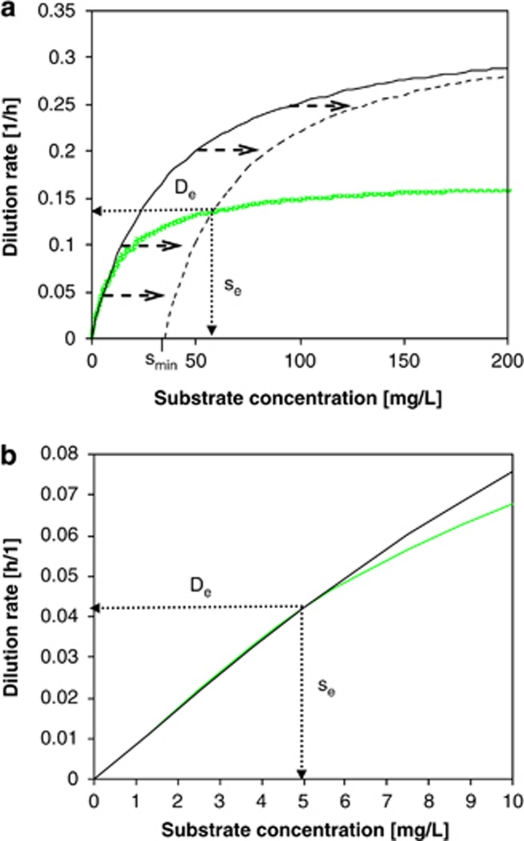
 )). All parameters were determined at D=0.075 h−1. C. heintzii will outcompete E. coli at s<se, whereas E. coli will outcompete C. heintzii at s>se. Coexistence is theoretically possible at De with a steady-state substrate concentration se. Kinetic parameters of the two competitors are listed in Table 2. (b) Zoom into the 0–10 μg l−1 concentration range of Figure 5a. At very low substrate concentration (0–5 μg l−1), the classical Monod kinetics predicts for both strains virtually the same specific growth rates and se is 5.0 μg l−1 suggesting coexistence, which is in contradiction to the competition experiments shown in Figure 2a.
Similar articles
-
Growth kinetics of Escherichia coli with galactose and several other sugars in carbon-limited chemostat culture.Can J Microbiol. 2000 Jan;46(1):72-80. doi: 10.1139/cjm-46-1-72. Can J Microbiol. 2000. PMID: 10696473
-
Temperature-dependent growth kinetics of Escherichia coli ML 30 in glucose-limited continuous culture.J Bacteriol. 1996 Aug;178(15):4530-9. doi: 10.1128/jb.178.15.4530-4539.1996. J Bacteriol. 1996. PMID: 8755881 Free PMC article.
-
The apparent clock-like evolution of Escherichia coli in glucose-limited chemostats is reproducible at large but not at small population sizes and can be explained with Monod kinetics.Microbiology (Reading). 2002 Sep;148(Pt 9):2889-2902. doi: 10.1099/00221287-148-9-2889. Microbiology (Reading). 2002. PMID: 12213934
-
Growth kinetics of suspended microbial cells: from single-substrate-controlled growth to mixed-substrate kinetics.Microbiol Mol Biol Rev. 1998 Sep;62(3):646-66. doi: 10.1128/MMBR.62.3.646-666.1998. Microbiol Mol Biol Rev. 1998. PMID: 9729604 Free PMC article. Review.
-
Flux analysis and control of the central metabolic pathways in Escherichia coli.FEMS Microbiol Rev. 1996 Dec;19(2):85-116. doi: 10.1111/j.1574-6976.1996.tb00255.x. FEMS Microbiol Rev. 1996. PMID: 8988566 Review.
Cited by
-
Solutions in microbiome engineering: prioritizing barriers to organism establishment.ISME J. 2022 Feb;16(2):331-338. doi: 10.1038/s41396-021-01088-5. Epub 2021 Aug 21. ISME J. 2022. PMID: 34420034 Free PMC article. Review.
-
Growth of bacteria in 3-d colonies.PLoS Comput Biol. 2017 Jul 27;13(7):e1005679. doi: 10.1371/journal.pcbi.1005679. eCollection 2017 Jul. PLoS Comput Biol. 2017. PMID: 28749935 Free PMC article.
-
Energetic investigations of Acidianus ambivalens metabolism during anaerobic sulfur reduction and comparisons to aerobic sulfur oxidation.Extremophiles. 2025 Apr 4;29(2):19. doi: 10.1007/s00792-025-01385-3. Extremophiles. 2025. PMID: 40183960
-
Bridging substrate intake kinetics and bacterial growth phenotypes with flux balance analysis incorporating proteome allocation.Sci Rep. 2020 Mar 9;10(1):4283. doi: 10.1038/s41598-020-61174-0. Sci Rep. 2020. PMID: 32152336 Free PMC article.
-
Predicting the decision making chemicals used for bacterial growth.Sci Rep. 2019 May 10;9(1):7251. doi: 10.1038/s41598-019-43587-8. Sci Rep. 2019. PMID: 31076576 Free PMC article.
References
-
- Alexander M. Biodegradation and Bioremediation. Academic Press Inc.: San Diego, California; 1994.
-
- Bally M, Wilberg E, Kühni M, Egli T. Growth and regulation of enzyme synthesis in the nitrilotriacetic acid (NTA) degrading bacterium Chelatobacter heintzii sp. ATCC 29600. Microbiology. 1994;140:1927–1936. - PubMed
-
- Bally M.1994Physiology and Ecology of Nitrilotriacetate Degrading Bacteria in Pure Culture, Activated Sludge and Surface WatersDiss. ETH Nr. 10821, Zürich, Switzerland.
-
- Baloo S, Ramkrishna D. Metabolic regulation in bacterial continuous cultures: I. Biotechnol Bioeng. 1991;38:1337–1352. - PubMed
MeSH terms
Substances
LinkOut - more resources
Full Text Sources
Molecular Biology Databases
Research Materials
