. 2011 Dec 1;187(11):5558-67.
doi: 10.4049/jimmunol.1101724. Epub 2011 Oct 26.

Coordinated regulation of lymph node vascular-stromal growth first by CD11c+ cells and then by T and B cells

Affiliations

Coordinated regulation of lymph node vascular-stromal growth first by CD11c+ cells and then by T and B cells

Susan Chyou et al. J Immunol. .

Abstract

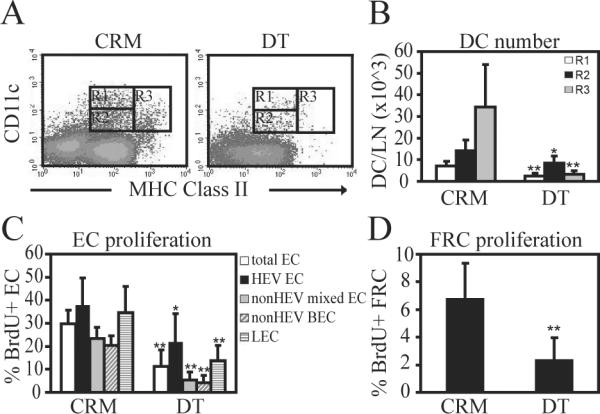
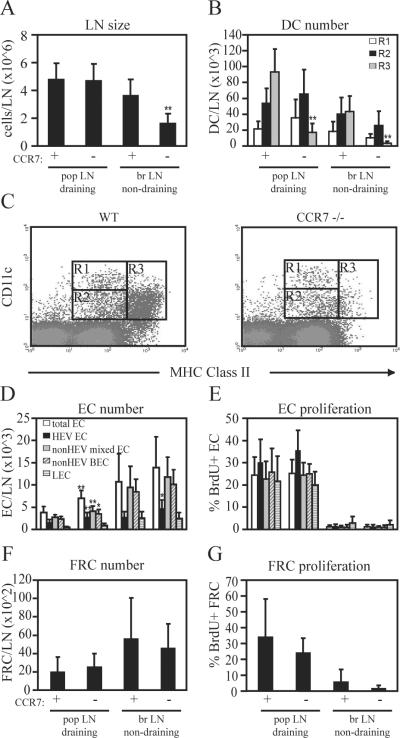
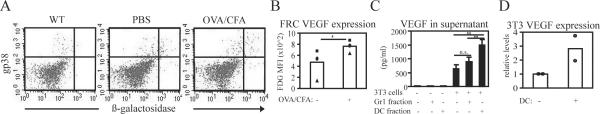
Lymph node blood vessels play important roles in the support and trafficking of immune cells. The blood vasculature is a component of the vascular-stromal compartment that also includes the lymphatic vasculature and fibroblastic reticular cells (FRCs). During immune responses as lymph nodes swell, the blood vasculature undergoes a rapid proliferative growth that is initially dependent on CD11c(+) cells and vascular endothelial growth factor (VEGF) but is independent of lymphocytes. The lymphatic vasculature grows with similar kinetics and VEGF dependence, suggesting coregulation of blood and lymphatic vascular growth, but lymphatic growth has been shown to be B cell dependent. In this article, we show that blood vascular, lymphatic, and FRC growth are coordinately regulated and identify two distinct phases of vascular-stromal growth--an initiation phase, characterized by upregulated vascular-stromal proliferation, and a subsequent expansion phase. The initiation phase is CD11c(+) cell dependent and T/B cell independent, whereas the expansion phase is dependent on B and T cells together. Using CCR7(-/-) mice and selective depletion of migratory skin dendritic cells, we show that endogenous skin-derived dendritic cells are not important during the initiation phase and uncover a modest regulatory role for CCR7. Finally, we show that FRC VEGF expression is upregulated during initiation and that dendritic cells can stimulate increased fibroblastic VEGF, suggesting the scenario that lymph node-resident CD11c(+) cells orchestrate the initiation of blood and lymphatic vascular growth in part by stimulating FRCs to upregulate VEGF. These results illustrate how the lymph node microenvironment is shaped by the cells it supports.


Figures

Figure 1
Figure 1. Lymph node vascular growth is characterized by an initial T/B cell-independent initiation phase followed by a T/B cell-dependent expansion phase
(A) Flow cytometry plots showing subsetting of CD45-CD31+ endothelial cells into PNAd+ HEV endothelial cells (HEV EC), PNAd-gp38− non-HEV blood vascular endothelial cells (non-HEV BEC), and PNAd-gp38+ lymphatic endothelial cells (LEC). (B–D) Wild-type (WT) or RAG1−/− mice were injected with 10^6 BMDCs in the hind footpads on day 0 and draining popliteal lymph nodes were examined on day 5. Unimmunized mice received either no footpad injection or were sham injected with PBS. (B) Lymph node cellularity as determined by count of lymph node cells. (C) Number of total CD45-CD31+ endothelial cells as determined by flow cytometric analysis. (D) Proliferation rate of CD45-CD31+ endothelial cells as determined by the percent of endothelial cells that are BrdU+. (E–J) WT or RAG1−/− mice were immunized with OVA/CFA on day 0 and draining popliteal nodes were examined on day 2 (E–G) or on day 5 (H–J). Unimmunized mice received either no footpad injection or were sham injected with PBS. (E, H) Lymph node cellularity. (F, I) Number of endothelial cells in each subset. (G, J) Proliferation rate of endothelial cell subsets. * indicates p value<.05 and ** indicates p value<.01 in comparison to the same cells in unimmunized controls of the same genotype using t-test; + indicates p-value<.05 and ++ indicates p-value<.01 in comparison to the same cells in WT mice receiving same treatment. For all studies except for the day 5 proliferation studies, n= at least 6 mice per group over at least 3 experiments. For day 5 proliferation studies, n=3 mice over 2 experiments for RAG1−/− PBS group, and n=at least 6 mice per group over at least 3 experiments for all other groups.
Figure 2
Figure 2. FRCs proliferate and expand with the endothelial cells
WT or RAG1y−/− mice were immunized with OVA/CFA on day 0 and draining popliteal nodes were examined on day 2 (B–C) or day 5 (D–E). (A) Gating scheme to identify gp38+ FRCs in flow cytometry plots. (B, D) Number of CD45-CD31-gp38+ FRCs at denoted time points. (C, E) FRC proliferation as measured by BrdU uptake at denoted time points. ** indicates p value<.01 in comparison to unimmunized controls of the same genotype using unpaired t-test; + indicates p-value<.05 in comparison to WT mice receiving same treatment. For all studies except for the day 5 proliferation studies, n= at least 6 mice per group over at least 3 experiments. For day 5 proliferation studies, n=3 mice over 2 experiments for RAG1−/− PBS group, and n=at least 6 mice per group over at least 3 experiments for all other groups.
Figure 3
Figure 3. B and T cells together mediate the expansion phase
μMT mice (A–E) and βδ TCR−/− (F–J) and controls were immunized with OVA/CFA on Day 0 and draining popliteal nodes were examined on day 5. CD4 and CD8 T cell-depleted μMT mice (K–M) were immunized as above but examined on day 4. (A, F, K) Lymph node cellularity. (B, G, L) Number of endothelial cells in each subset. (C, H) Proliferation rate of endothelial cells in each subset. (D, I, M) Numbers of gp38+ FRCs. (E, J) Proliferation rate of gp38+ FRCs. For μMT mice and βδ TCR−/−, n=5–6 mice in each group over 3 experiments. For T cell-depleted μMT mice, n=5 mice in each group over 2 experiments. * indicates p value<.05 and ** indicates p value<.01 in comparison to the same cells in unimmunized controls of the same genotype using t-test; + indicates p-value<.05 and ++ indicates p-value<.01 in comparison to the same cells in WT mice receiving same treatment.
Figure 4
Figure 4. CD11c+ cells mediate upregulation of proliferation of blood and lymphatic endothelial cells and of FRCs during the initiation phase
CD11c-DTR mice were injected with 100ng DT or control inactive mutant toxin (CRM) in the right footpad at 8 hours before OVA/CFA injection in the same footpad on day 0. Draining popliteal nodes were examined on day 2. (A) Flow cytometry plots showing relative depletion of all CD11c+ cell subsets with DT. (B) Number of cells per lymph node in the gates shown in (A). (C) Proliferation rate of endothelial cell subsets as measured by BrdU uptake. (D) Proliferation rate of gp38+ FRCs. * indicates p value<.05 and ** indicates p value<.01 in comparison to the same cells in CRM-treated mice using unpaired t-test. n=6 mice per condition over 4 experiments.
Figure 5
Figure 5. CCR7-dependent cells do not mediate upregulation of endothelial and FRC proliferation during the initiation phase
Wild-type (WT) or CCR7−/− mice were immunized with OVA/CFA on day 0 and draining popliteal nodes and non-draining brachial nodes were examined on day 2. (A) Lymph node cellularity. (B) Number of dendritic cells per lymph node in the gates shown in (C). (C) Flow cytometry plot showing relative lack of CD11cmedMHCIIhi cells in CCR7−/− popliteal lymph nodes at day 2 after OVA/CFA. (D) Number of endothelial cells in all subsets. (E) Proliferation rate of endothelial cells. (F) Number of gp38+ FRCs. (G) Proliferation rate of gp38+ FRCs. Comparisons were made between WT and CCR7−/− samples using upaired t-test. * indicates p value<.05 and ** indicates p value<.01 in comparison to the equivalent cells in WT mice. n for proliferation determination= 5 mice per group over 2 experiments; n for lymph node, dendritic cell, endothelial cell, and FRC numbers=at least 7 mice per group over at least 3 experiments.
Figure 6
Figure 6. Depletion of skin-derived CD11c+ cells does not affect lymph endothelial cell proliferation during the initiation phase
CD11c-DTR mice were injected with 25ng DT or CRM in the right footpad at 8 hours before OVA/CFA injection in the same footpad on day 0. Draining popliteal nodes were examined on day 2. (A) Flow cytometry plot showing depletion of CD11cmedMHCIIhi cells with DT. (B) Number of cells per lymph node in the gates shown in (A). (C) Endothelial cell proliferation. * indicates p value<.05 in comparison to same cells in CRM-treated mice using unpaired t-test. n =6 mice per group over 4 experiments.
Figure 7
Figure 7. VEGF is upregulated in FRCs in vivo and in fibroblasts cultured with dendritic cells
(A–B) VEGF-lacZ mice were immunized with OVA/CFA on day 0 and draining popliteal nodes were examined on day 2. Beta-galactosidase activity as an indicator of VEGF expression was measured as described in Methods. (A) Flow cytometry dot plots gated on CD45-CD31- cells showing beta-galactosidase activity of gp38+ FRCs from an immunized wild-type mouse, a sham-immunized VEGF-lacZ mouse, and an OVA/CFA-immunized VEGF-lacZ mouse. (B) Graph shows mean fluorescence intensity of gp38+ FRCs in the VEGF-lacZ mice. * indicates p value<.05 in comparison to unimmunized mice using paired t-test. Each symbol represents 1 mouse, with matched symbols in the unimmunized and OVA/CFA-immunized conditions representing a pair from a single experiment. Data was accumulated over 4 experiments. (C–D) 3T3 fibroblasts were cultured alone or with Gr-1 cell-depleted BMDCs (DC fraction) or the Gr1+ contaminating cells (Gr1 fraction) for 2 days. (C) VEGF levels in the culture supernatants. * p<.05 and ** p<.01 t-test. Each condition was plated in triplicate wells; bars show average value of the triplicate wells. Results representative of at least 5 similar experiments. (D) VEGF mRNA level in the 3T3 cells after culturing without or with DC fraction, as measured by real-time PCR. Each bar represents average values of two experiments, with each symbol representing the value obtained in a single experiment.

References

    1. von Andrian UH, Mempel TR. Homing and cellular traffic in lymph nodes. Nat Rev Immunol. 2003;3 - PubMed
    1. Mueller SN, Germain RN. Stromal cell contributions to the homeostasis and functionality of the immune system. 2009;9 - PMC - PubMed
    1. Lammermann T, Sixt M. The microanatomy of T-cell responses. Immunol Rev. 2008;221 - PubMed
    1. Junt T, Scandella E, Ludewig B. Form follows function: lymphoid tissue microarchitecture in antimicrobial immune defence. Nat Rev Immunol. 2008;8 - PubMed
    1. Soderberg KA, Payne GW, Sato A, Medzhitov R, Segal SS, Iwasaki A. Innate control of adaptive immunity via remodeling of lymph node feed arteriole. Proc Natl Acad Sci U S A. 2005;102 - PMC - PubMed

Publication types

MeSH terms

Substances