. 2012 Jan 19;119(3):756-66.
doi: 10.1182/blood-2011-02-338004. Epub 2011 Oct 26.

Mechanism of transfer of functional microRNAs between mouse dendritic cells via exosomes

Affiliations

Mechanism of transfer of functional microRNAs between mouse dendritic cells via exosomes

Angela Montecalvo et al. Blood. .

Abstract

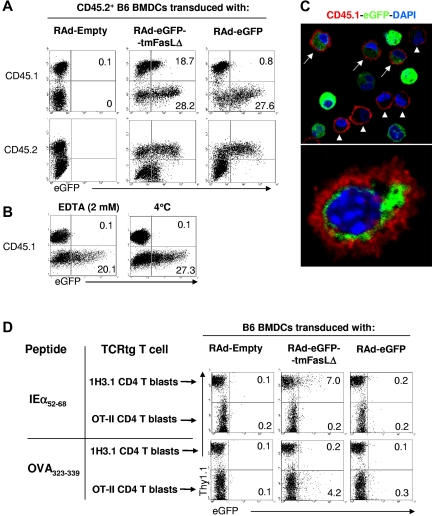
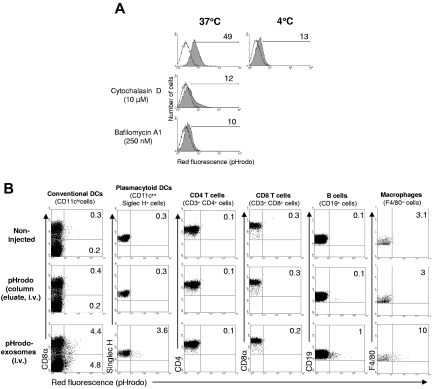
Dendritic cells (DCs) are the most potent APCs. Whereas immature DCs down-regulate T-cell responses to induce/maintain immunologic tolerance, mature DCs promote immunity. To amplify their functions, DCs communicate with neighboring DCs through soluble mediators, cell-to-cell contact, and vesicle exchange. Transfer of nanovesicles (< 100 nm) derived from the endocytic pathway (termed exosomes) represents a novel mechanism of DC-to-DC communication. The facts that exosomes contain exosome-shuttle miRNAs and DC functions can be regulated by exogenous miRNAs, suggest that DC-to-DC interactions could be mediated through exosome-shuttle miRNAs, a hypothesis that remains to be tested. Importantly, the mechanism of transfer of exosome-shuttle miRNAs from the exosome lumen to the cytosol of target cells is unknown. Here, we demonstrate that DCs release exosomes with different miRNAs depending on the maturation of the DCs. By visualizing spontaneous transfer of exosomes between DCs, we demonstrate that exosomes fused with the target DCs, the latter followed by release of the exosome content into the DC cytosol. Importantly, exosome-shuttle miRNAs are functional, because they repress target mRNAs of acceptor DCs. Our findings unveil a mechanism of transfer of exosome-shuttle miRNAs between DCs and its role as a means of communication and posttranscriptional regulation between DCs.


Figures

Figure 1
Figure 1
miRNA in BMDC-derived immature and mature exosomes. (A) Western blot analysis (top) of 1-mL density fractions from a continuous sucrose gradient used to purify BMDC exosomes. Exosomes, detected by their CD9 expression, were enriched in those fractions with characteristic exosome density. The digital gel (bottom), obtained with Agilent 2100 Bioanalyzer, shows the presence of miRNAs in the density fractions in which exosomes were present. One of 2 experiments is shown. (B) Digital gel (Agilent 2100 Bioanalyzer) showing the presence of similar levels of miRNAs isolated from exosomes treated (or not) with proteinase K and then incubated (or not) with RNase A. Results are representative of 2 independent experiments. (C) Analysis of miRNAs from BMDC exosomes showing intensity of expression of miRNAs against their rank position. Signals above the 2500 cutoff were considered positive. (D) Venn diagram with the numbers of miRNAs detected in immature and mature exosomes released by BMDCs. List with the miRNAs detected by Illumina miRNA Expression Array. In those cases were the probe did not resolve miRNAs differing at only 1 or 2 positions, miRNAs were listed in parentheses. Results are based on the miRNA profiling of 4 different samples of each type of exosomes.
Figure 2
Figure 2
Differential miRNA content in BMDC-derived immature and mature exosomes. (A) Correlation plot of exosome miRNAs, indicating in red those miRNAs expressed differentially by immature and mature exosomes. (B) Expression pattern grid with miRNAs expressed differentially by immature and mature exosomes. Each box corresponds to a gene for a given sample of an experimental group. If the individual sample expression value for that miRNA is > 95 percentile of the same miRNA from the other sample group (considered as a group), it is colored red. If that individual miRNA expression value is < 5 percentile of the same miRNA from the other experimental group, it is painted green. If the expression value falls within the range of the 5th and 95th percentiles, it is represented as a black square. The groupings of miRNAs fall out logically according to the counts of the colored squares; the predominantly red and green group represents those miRNAs whereby the miRNA is overexpressed in all mature exosome samples (group a), or in all immature exosomes samples (group e). Group b represents miRNAs whereby the trend is toward overexpression in mature exosomes, and so on. The 2 main groups of most reliable differences are groups a and e. The black versus black (ie, group f) is actually miRNAs that have equal numbers of squares colored red, green, and black and are, therefore, not actually different; the measure of difference being high for such miRNAs may be because of outliers. Four independent samples of each type of exosome were analyzed.
Figure 3
Figure 3
Transfer of endogenous exosomes between BMDCs. (A) FACS analysis of transfer of eGFP between 106 CD45.2+ BMDCs transfected with RAd-eGFP-tmFasLΔ (or control RAd-Empty or RAd-eGFP) and 106 acceptor CD45.1+ BMDCs. Numbers are percentages of cells. (B) Effect of EDTA and temperature on transfer of exosomes between CD45.2+ RAd-eGFP-tmFasLΔ-transfected BMDCs and CD45.1+ BMDCs. (C top) Confocal microscopy of CD45.1+ BMDCs (in red) incubated with CD45.2+ BMDCs transfected with RAd-eGFP-tmFasLΔ. Arrows indicate acceptor (CD45.1+) BMDCs with eGFP+ content. As control, arrowheads show some acceptor BMDCs without eGFP. (Bottom) eGFP inside an acceptor BMDC surface labeled with CD45.1 (in red; ×1000). (D) Detection by FACS of transfer of eGFP between BMDCs and TCR transgenic (tg) T cells in a 3-cell culture system. One million BMDCs transfected with RAd-eGFP-tmFasLΔ (or control RAd-Empty or RAd-eGFP) and pulsed with IEα52-68 or OVA323-339 peptide were cocultured with in vitro–activated (blasts) 1H3.1 (Thy1.1+) and OT-II (Thy1.2+) CD4 T cells (5 × 10⁶ of each). CD11c+ cells (BMDCs) were gated out. Numbers are percentages of cells. One of 3 (A,D) or 2 (B-C) experiments is shown.
Figure 4
Figure 4
Internalization of BMDC-derived exosomes. (A) In vitro assay of internalization of pHrodo-exosomes (5 μg, purified by gel filtration) by BMDCs (5 × 10⁵ cells, 1 mL of final volume) assessed by FACS. Numbers are percentages of positive cells. One of 2 independent experiments is shown. (B) In vivo endocytosis of pHrodo-labeled exosomes (300 μg, intravenously, purified by gel filtration) by different splenic leukocytes, analyzed by FACS, 3 hours after exosome administration. Numbers are percentages of positive cells in the corresponding quadrant. Results are representative of 3 mice per group.
Figure 5
Figure 5
Fusion/hemifusion of exosomes with BMDCs. (A) Structure of R18-labeled exosomes purified by gel filtration (×100 000). Bar = 100 nm. (B) Spectrofluorimetric analysis after addition of (unlabeled) BMDCs to R18-exosomes. When R18-exosomes were incubated alone (control) fluorescence increased only after their disruption with Triton X-100 (T X100). (C-F) Fusion assays of R18-exosomes with BMDCs at different conditions. (B-F) Results are expressed as percentages of maximal fluorescence de-quenching [FD (%)]. Spectrofluorimetric assays were done exposing 106 BMDCs to 10 μg of R18-exosomes in a final volume of 2 mL of 2 g/L glucose Ca/Mg HBSS. (G) Differential interference contrast (top) and fluorescence (bottom) images during fusion/hemifusion of R18-exosomes with BMDCs. Arrow indicates the fusion/hemifusion of one R18-exosome(s) with the BMDC on the right, detected when the area of diffusion of de-quenched R18 on the DC surface reached the limit of resolution of the objective. Images were pseudo-colored to indicate the intensity of light. Arrowhead points to another fusion of an R18-exosome(s) with a neighboring BMDC. The chart shows the quantitative analysis of the cells from the images (×400). For fluorescence time-lapse microscopy, 150 000 BMDCs were incubated with 2.5 μg of R18-exosomes in a final volume of 500 μL. Results (B-G) represent ≥ 3 experiments per condition.
Figure 6
Figure 6
Release of luminal content of exosomes and acquisition of exosome-shuttle miRNAs by DCs. (A) Content-mixing assay between 106 BMDCs transduced with RAd-LUC (Luciferase BMDCs or with RAd-Empty, control BMDCs) and 10 μg exosomes loaded with luciferin (or not, Control-Exosomes) added to the DCs 3 minutes later. The assays were done in a final volume of 2 mL of 2 g/L glucose Ca/Mg HBSS. Luciferase BMDCs incubated alone were included as negative controls. (B) Content-mixing assay between 106 control BMDCs and 10 μg of exosomes loaded with luciferin (or not, Control-Exosomes) added to the DCs 3 minutes later. (C) Ultrastructural analysis of the interaction of exogenously added (BALB/c) BMDC exosomes surface labeled with 5 nm of gold particles (IAd+, arrowheads) with the plasma membrane of an acceptor BMDC (B6, IAd−). The arrow shows the tight contact between the surface membrane of the BMDCs and the membrane of the labeled exosome (×100 000). Bar = 100nm. (D) Internalized 5 nm of gold-labeled (arrowheads) exosomes (arrows) inside a BMDC phagosome (×100 000). Bar = 100nm. The area within the dotted line is shown at higher detail on the right. (E) Luciferase reporter construct with 3 tandem copies of the target sequence to miR-451 or miR-148a located in the 3′-untranslated region and the control vector with the inverted sequences. (F-G) Normalized expression of luciferase in 106 DC2.4 cells transfected with pCMV-Luc/3 × PT-miR-451 or control pCMV-Luc/3 × PT-inverted-miR-451 (F), or with pCMV-Luc/3 × PT-miR-148a or control pCMV-Luc/3 × PT-inverted-miR-148a (G), after 18 hours incubation alone, or with increasing concentrations of exosomes in complete medium. Shown results are representative of 4 (A-B), 12 (C-D), and 3 (F-G) independent experiments.

Comment in

References

    1. Wang K, Zhang S, Weber J, Baxter D, Galas DJ. Export of microRNAs and microRNA-protective protein by mammalian cells. Nucleic Acids Res. 2010;38(20):7248–7259. - PMC - PubMed
    1. Hunter M, Ismail N, Zhang X, et al. Detection of microRNA expression in human peripheral blood microvesicles. PloS One. 2008;3:e3694. - PMC - PubMed
    1. Skog J, Wurdinger T, van Rijn S, et al. Gliobastoma microvesicles transport RNA and proteins that promote tumour growth and provide diagnostic biomarkers. Nat Cell Biol. 2008;10(12):1470–1476. - PMC - PubMed
    1. Valadi H, Ekstrom K, Bossios A, Sjostrand M, Lee JJ, Lotvall JO. Exosome-mediated transfer of mRNAs and microRNAs is a novel mechanism of genetic exchange between cells. Nat Cell Biol. 2007;9(7):654–659. - PubMed
    1. Taylor DD, Gercel-Taylor C. MicroRNA signatures of tumor-derived exosomes as diagnostic biomarkers of ovarian cancer. Gynecol Oncol. 2008;110(1):13–21. - PubMed

Publication types