. 2011 Oct 26;31(43):15320-8.
doi: 10.1523/JNEUROSCI.3266-11.2011.

Small heat-shock protein HSPB1 mutants stabilize microtubules in Charcot-Marie-Tooth neuropathy

Affiliations

Small heat-shock protein HSPB1 mutants stabilize microtubules in Charcot-Marie-Tooth neuropathy

Leonardo Almeida-Souza et al. J Neurosci. .

Abstract

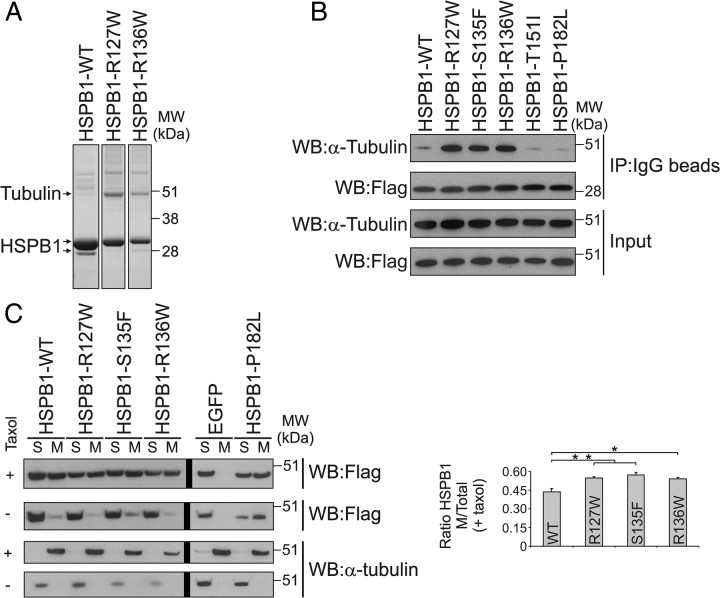
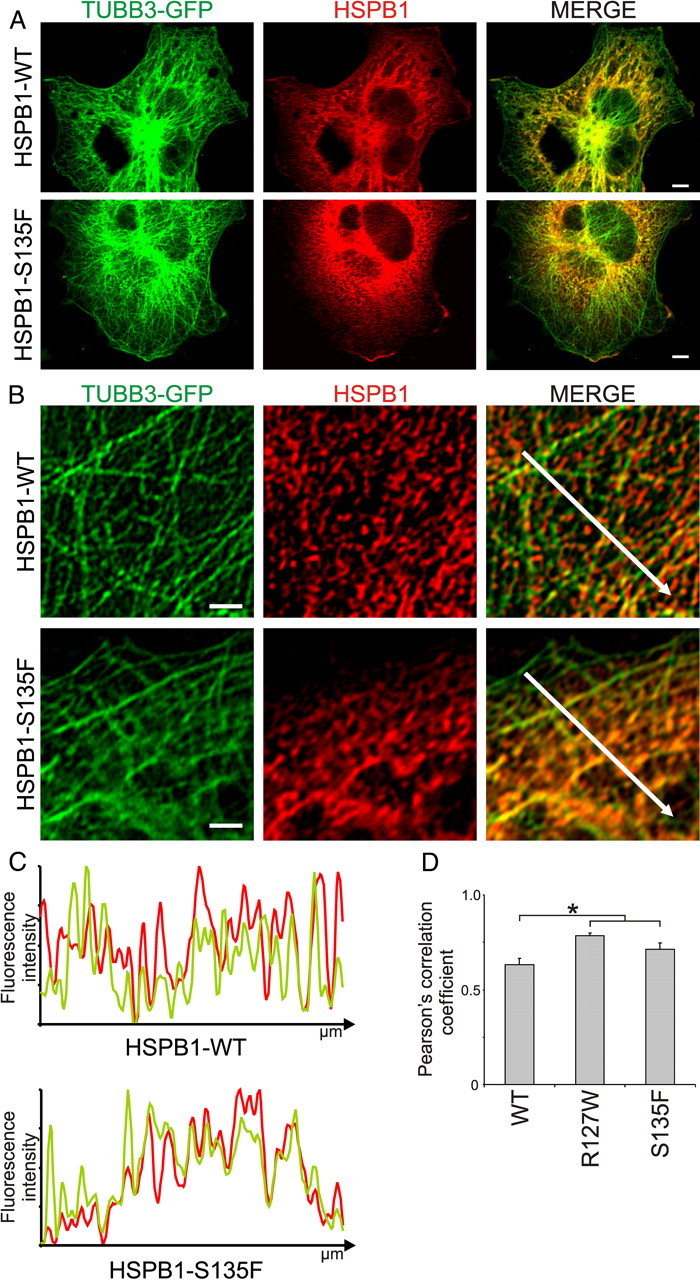
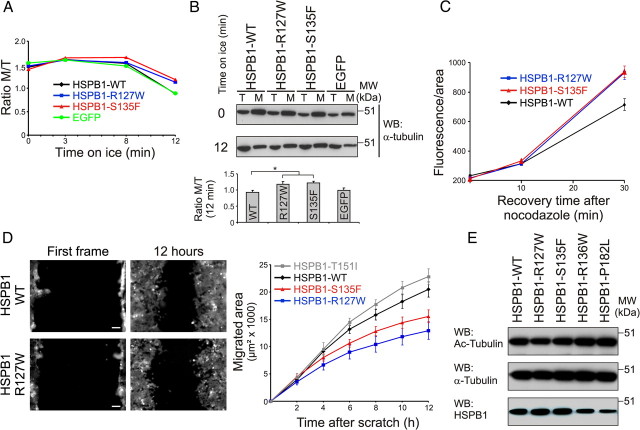
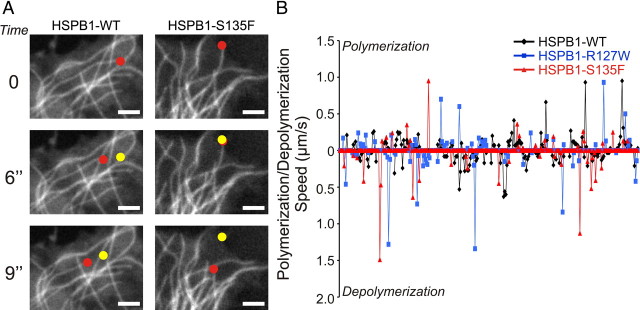
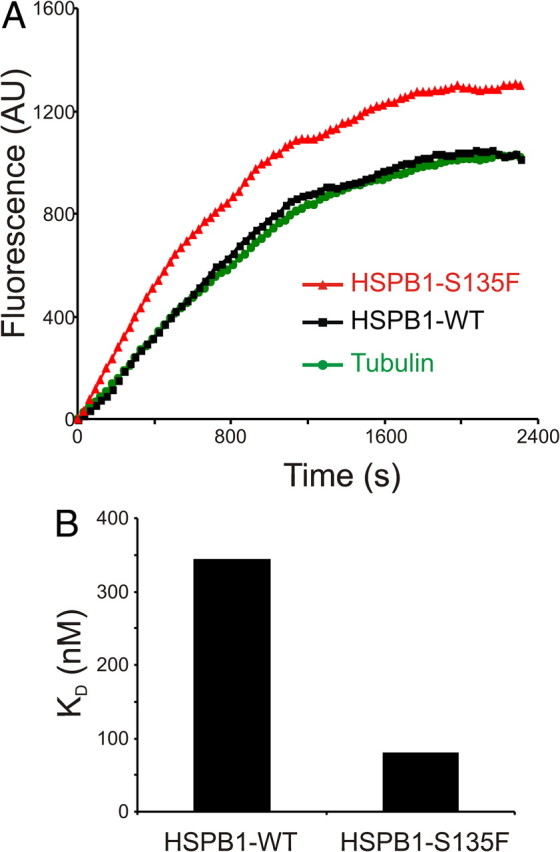
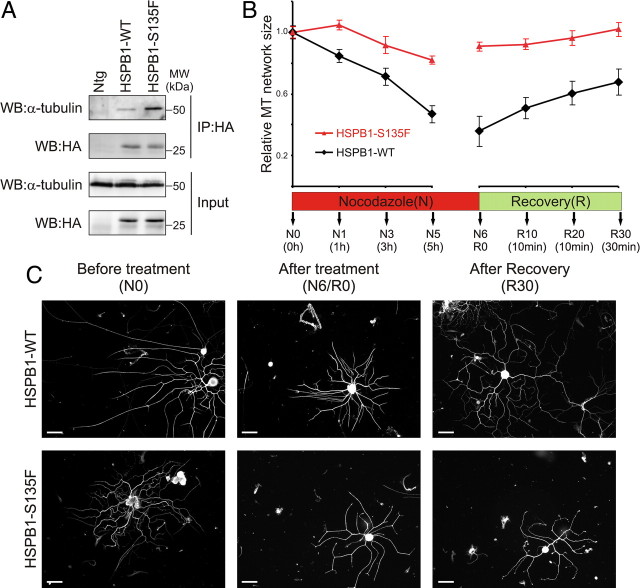
Mutations in the small heat shock protein HSPB1 (HSP27) are causative for Charcot-Marie-Tooth (CMT) neuropathy. We previously showed that a subset of these mutations displays higher chaperone activity and enhanced affinity to client proteins. We hypothesized that this excessive binding property might cause the HSPB1 mutant proteins to disturb the function of proteins essential for the maintenance or survival of peripheral neurons. In the present work, we explored this hypothesis further and compared the protein complexes formed by wild-type and mutant HSPB1. Tubulin came out as the most striking differential interacting protein, with hyperactive mutants binding more strongly to both tubulin and microtubules. This anomalous binding leads to a stabilization of the microtubule network in a microtubule-associated protein-like manner as reflected by resistance to cold depolymerization, faster network recovery after nocodazole treatment, and decreased rescue and catastrophe rates of individual microtubules. In a transgenic mouse model for mutant HSPB1 that recapitulates all features of CMT, we could confirm the enhanced interaction of mutant HSPB1 with tubulin. Increased stability of the microtubule network was also clear in neurons isolated from these mice. Since neuronal cells are particularly vulnerable to disturbances in microtubule dynamics, this mechanism might explain the neuron-specific CMT phenotype caused by HSPB1 mutations.


Figures

Figure 1.
Figure 1.
Hyperactive HSPB1 mutants bind to tubulin and microtubules. A, Coomassie staining of the final eluates from TAPs from HEK293Flp-in cells expressing TAP-tagged HSPB1-WT, R127W, and R136W. The prominent ∼50 kDa band was identified by mass spectrometry as α- and β-tubulin. B, Immunoprecipitations from HEK293Flp-in cells confirmed that the three hyperactive HSPB1 mutants (R127W, S135F, and R136W) displayed enhanced binding to tubulin. HSPB1 was detected using anti-flag antibody. Differences in HSPB1 size between input and the IP fractions are due to the removal of the Protein A tag during the elution step by TEV cleavage. C, Cosedimentation assay performed to evaluate HSPB1 binding to MTs. Cell extracts from HEK293Flp-in cells expressing different HSPB1 isoforms were supplemented or not with GTP and taxol, and incubated at 37°C to allow MT polymerization. MTs were then separated from tubulin by ultracentrifugation, and the amount of HSPB1 bound to MTs (visualized by anti-Flag Western blot) was determined by calculating the ratio between the amount of HSPB1 in the MT and the total amount of HSPB1 from the reactions supplemented with taxol (Graph, n = 3 independent experiments). Vertical thick black lines shown in Western blots correspond to divisions between gels. Data are presented as mean ± SEM. M, MT-containing fraction; S, soluble fraction. *p < 0.05; **p < 0.01.
Figure 2.
Figure 2.
Colocalization of mutant HSPB1 and microtubules in cells. A, Overview image from Cos-1 cells transiently transfected with constructs harboring GFP-TUBB3 and V5-tagged HSPB1-WT or the HSPB1–S135F and stained for HSPB1. Scale bar, 5 μm. B, Representative pictures for the staining with anti-HSPB1 antibody showing preferential localization of the HSPB1–S135F mutant to MT regions (bottom) in contrast to the overall distribution of the HSPB1-WT (top). Scale bar, 2 μm. C, Normalized fluorescence intensity profiles for the white arrows traced in the merged pictures. The graphs for the HSPB1S135F mutant clearly show the correspondence between fluorescence peaks and valleys of HSPB1 and MT, while this correspondence is less clear for HSPB1WT. D, Pearson's correlation coefficient between HSPB1 staining and TUBB3-GFP was calculated for 50 independent areas from 10 different cells. Data are presented as mean ± SEM. *p < 0.05.
Figure 3.
Figure 3.
Hyperactive HSPB1 mutants stabilize microtubules. A, B, Cold-induced MT depolymerization assay. HEK293Flp-in cells expressing different HSPB1 isoforms and EGFP as a negative control were placed on ice for different periods of time and separated into tubulin (T) and MT (M) fractions. The ratio of polymerized tubulin was calculated by dividing the tubulin signal intensity from M and T fractions. A, Graph showing the ratio of polymerized tubulin at different time points. B, Western blot showing tubulin and MT fractions at the zero and 12 min time points, and quantification of the ratio M/T (n = 3). C, MT network recovery experiment after nocodazole washout. HeLa cells stably expressing different HSPB1 isoforms were treated with 10 μm nocodazole for 6 h; allowed to recover for 0, 10, and 30 min; treated with detergent to remove soluble tubulin; and stained for tubulin. MT network recovery was measured as total fluorescence per cell (n = 58, 50, and 48 for WT; 53, 48, and 70 for R127W; and 53, 73, and 77 for S135F). Data points for HSPB1–R127W and HSPB1–S135F are statistically different from HSPB1-WT at 30 min (p < 0.01). D, Scratch-induced migration assay. HEK293Flp-in cells expressing different HSPB1 isoforms were grown until confluence and scratched with a pipette tip. Cells were imaged overnight, and migration was measured as the area migrated by cells every 2 h (n = 12, 14, 20, and 14 for WT, R127W, S135F, and T151I, respectively). Scale bar, 80 μm. Data points for HSPB1–R127W and HSPB1–S135F are statistically different from HSPB1-WT and HSPB1–T151I at 6, 8, 10, and 12 h (p < 0.01). Data are presented as mean ± SEM. E, Tubulin acetylation levels in HEK293Flp-in cells expressing different HSPB1 isoforms.
Figure 4.
Figure 4.
Mutant HSPB1 stabilized microtubules depolymerize less often, but once they do, at higher speeds. A, Time-lapse microscopy from cells expressing HSPB1WT or HSPB1S135F and TUBB3-GFP. Red dots represent current position of MT tips, while yellow dots represent the position of the MT tips in the previous frame. MTs in cells expressing HSPB1S135F are more paused (shown here as the yellow and red dots overlapping on the same position), but once they depolymerize, they show a faster depolymerization speed than MT from cells expressing HSPB1WT. Scale bar, 2 μm. B, Graphical representation of life stories of MTs from cells expressing HSPB1WT and mutants. Note that, in general, MTs in mutant HSPB1-expressing cells move less (are more often on the horizontal axis representing the paused condition) and that, especially for the depolymerization phase, peaks—representing speed—are higher for mutants. Graph shows the concatenated life story of seven MTs for each genotype.
Figure 5.
Figure 5.
Hyperactive HSPB1 mutants stabilize microtubules in vitro. A, MT in vitro polymerization assay. Ten micromolar tubulin was polymerized alone or in the presence of 5 μm recombinant HSPB1WT or HSPB1S135F mutant. MT polymerization was measured as increasing DAPI fluorescence over time (see Experimental procedure section for details). B, Dissociation constants (KD) of HSPB1WT and HSPB1S135F to tubulin using surface plasmon resonance. Sensorgram data were fitted using a steady-state binding model, and saturation titration experiments were for the calculation of KD. AU, Arbitrary units.
Figure 6.
Figure 6.
The microtubule-stabilizing property of mutant HSPB1 is confirmed in HSPB1S135F transgenic mice. A, Immunoprecipitation of HSPB1 from sciatic nerves of mice expressing HA-tagged HSPB1WT, HSPB1S135F, and nontransgenic (Ntg) mice confirmed the differential interaction of HSPB1S135F to tubulin in vivo. B, MT stability measurement on DRG neurons from transgenic mice. MT stability was evaluated as the extent of the MT network within the DRG neurites from transgenic mice during (N) and after (R) nocodazole treatment (n = 40 neurites per time point). Data points for HSPB1S135F are statistically different from HSPB1WT at all time points, except for those at the start of the treatment (p < 0.01). Neuritic MT network extent was normalized to the initial size before treatment (N0). Data are presented as mean ± SEM. C, Representative pictures of DRG neurons from transgenic mice used at measurements shown in B. Neurons are stained for α-tubulin. Scale bar, 200 μm.

References

    1. Akella JS, Wloga D, Kim J, Starostina NG, Lyons-Abbott S, Morrissette NS, Dougan ST, Kipreos ET, Gaertig J. MEC-17 is an alpha-tubulin acetyltransferase. Nature. 2010;467:218–222. - PMC - PubMed
    1. Almeida-Souza L, Goethals S, de Winter V, Dierick I, Gallardo R, Van Durme J, Irobi J, Gettemans J, Rousseau F, Schymkowitz J, Timmerman V, Janssens S. Increased monomerization of mutant HSPB1 leads to protein hyperactivity in Charcot-Marie-Tooth neuropathy. J Biol Chem. 2010;285:12778–12786. - PMC - PubMed
    1. Baas PW, Karabay A, Qiang L. Microtubules cut and run. Trends Cell Biol. 2005;15:518–524. - PubMed
    1. Barisic N, Claeys KG, Sirotković-Skerlev M, Löfgren A, Nelis E, De Jonghe P, Timmerman V. Charcot-Marie-Tooth disease: a clinico-genetic confrontation. Ann Hum Genet. 2008;72:416–441. - PubMed
    1. Barron DM, Chatterjee SK, Ravindra R, Roof R, Baloglu E, Kingston DG, Bane S. A fluorescence-based high-throughput assay for antimicrotubule drugs. Anal Biochem. 2003;315:49–56. - PubMed

Publication types

MeSH terms