. 2011 Oct 26;31(43):15391-6.
doi: 10.1523/JNEUROSCI.2801-11.2011.

Bmal1 in the nervous system is essential for normal adaptation of circadian locomotor activity and food intake to periodic feeding

Affiliations

Bmal1 in the nervous system is essential for normal adaptation of circadian locomotor activity and food intake to periodic feeding

Michihiro Mieda et al. J Neurosci. .

Abstract

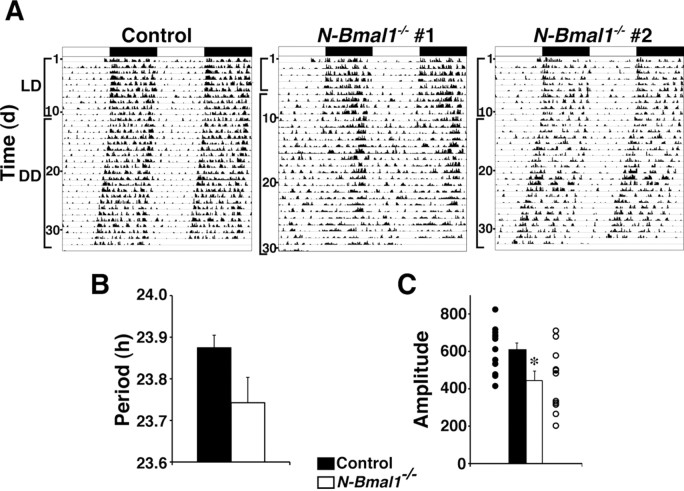
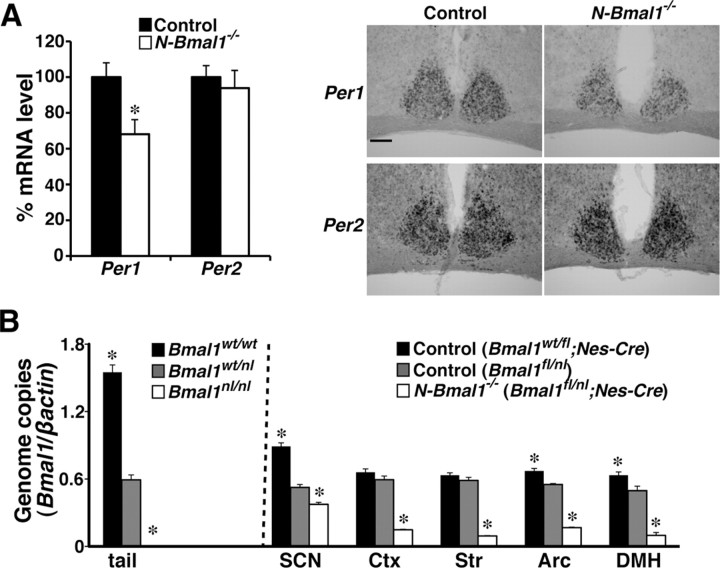
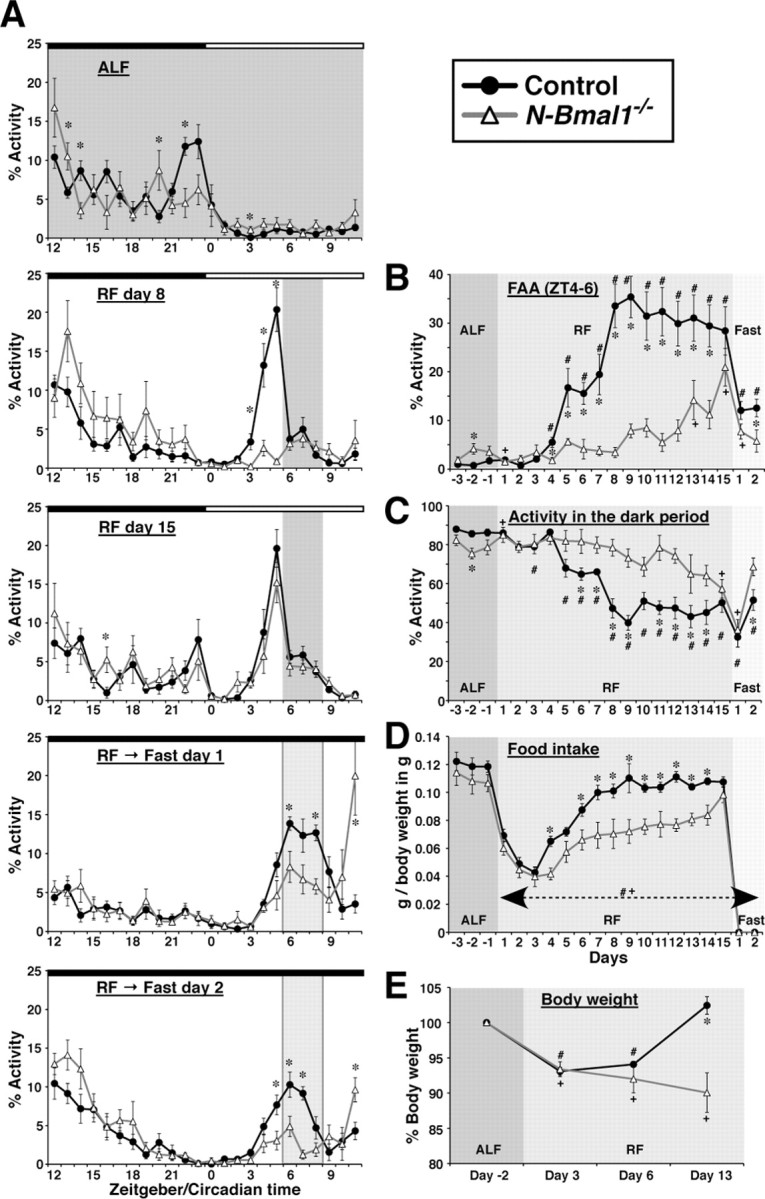
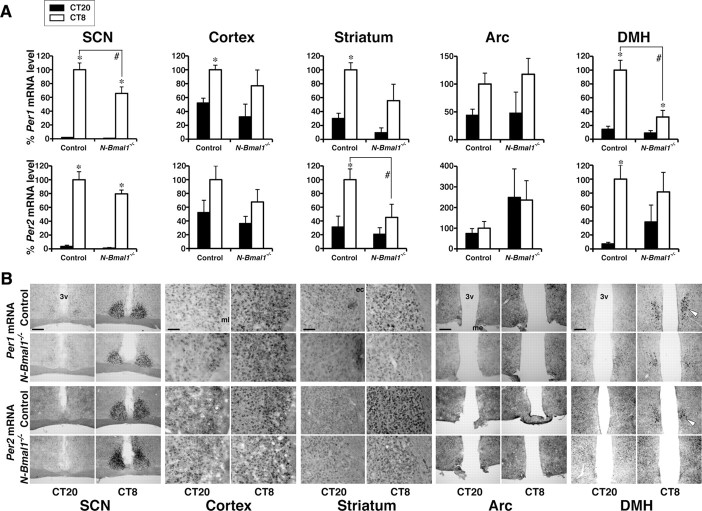
Temporal restriction of feeding can entrain circadian behavioral and physiological rhythms in mammals. These changes in biological rhythms are postulated to be brought about by a putative food-entrainable oscillator (FEO) that is independent of the suprachiasmatic nucleus (SCN). However, the anatomical substrates and molecular machinery of FEO remain elusive. We report here that mice with a nervous system-specific deletion of Bmal1, an essential clock component, had a marked deficit in entrainment of locomotor activity by periodic feeding, accompanied by reduced food intake and subsequent loss of body weight. These mice exhibited a nearly normal light-entrainable activity rhythm driven by the SCN, because deletion of the Bmal1 gene in the SCN was only partial. These findings suggest that an SCN-independent FEO in the nervous system requires Bmal1 and plays a critical role in adaptation of circadian locomotor activity and food intake to periodic feeding.


Figures

Figure 1.
Figure 1.
SCN-driven light-entrainable activity rhythm is only slightly attenuated in N-Bmal1−/− mice. A, Representative locomotor activity of one control and two N-Bmal1−/− mice. Animals were initially housed in LD conditions and then transferred to DD. Figure shows typical examples of activity rhythm of N-Bmal1−/− mice. Timing of LD cycle is indicated by horizontal bar above each record; dark bars indicate lights off, and open bars indicate lights on. B, C, Periodogram estimates of free-running period (B) and circadian amplitude (C, power from periodogram analyses) of control (black bars) and N-Bmal1−/− mice (white bars) during the last 10 d in DD. In C, value of each individual mouse is dot-plotted. *p < 0.05 by unpaired Student's t test. Values are mean ± SEM (n = 12 for control, n = 11 for N-Bmal1−/− mice).
Figure 2.
Figure 2.
Bmal1 function is mostly retained in SCN of N-Bmal1−/− mice. A, Per1 and Per2 mRNA expression levels in SCN of control mice (black bar) and N-Bmal1−/− mice (white bar) at CT8 determined by in situ hybridization. *p < 0.05 by unpaired Student's t test. Values are mean ± SEM (n = 5). Representative images are shown on the right. Scale bar, 200 μm. B, Efficiency of Cre-mediated recombination of Bmal1fl allele. Amounts of Bmal1wt and Bmal1fl alleles were quantified by real-time PCR and normalized to those of β-actin gene. A pilot analysis of genomic DNA extracted from tails (shown in leftmost field) of Bmal1w/w (black bar), Bmal1wt/nl (gray bar), and Bmal1nl/nl (white bar) mice confirmed the specificity and quantitative performance of amplification. Genomic DNA extracted from SCN, cerebral cortex, striatum, arcuate hypothalamic nucleus (Arc), and DMH of Bmal1wt/fl;Nes-Cre (black bars) and Bmal1fl/nl (gray bars) control mice and N-Bmal1−/− mice (white bars) was subjected to similar quantitative PCR. *p < 0.05 by unpaired Student's t test vs Bmal1wt/nl mice (tail) or Bmal1fl/nl mice (brain tissues). Values are mean ± SEM (n = 3 for tail analysis, n = 4 for Bmal1wt/fl;Nes-Cre mice, n = 3 for Bmal1fl/nl mice, n = 6 for N-Bmal1−/− mice). Ctx, Cerebral cortex; Str, striatum.
Figure 3.
Figure 3.
Entrainment of circadian activity rhythm and food intake by periodic feeding is markedly delayed and attenuated in N-Bmal1−/− mice. A, Hourly plots of locomotor activity of control and N-Bmal1−/− mice under ALF or on the indicated day under RF or fasting following RF. Activity counts are expressed as percentage of daily total. Note that FAA during fasting days appears to be reduced substantially compared with day 15 under RF due to this normalization. The period of food availability and expected period of food availability under fasting are shaded in dark and light gray, respectively. Black and white bars on top of each graph represent times of lights off and on, respectively. B, Time course of development of FAA in control and N-Bmal1−/− mice. The daily percentage of locomotor activity allocated to a 2 h time interval, zeitgeber time (ZT)4–6, is shown. C, Time course of reduction of activity during dark period. D, Time course of change in daily food intake. Data shown are normalized to body weight. E, Time course of change in body weight. Data are expressed as percentage of body weight under ALF. *p < 0.05 control vs N-Bmal1−/− mice at each time point by unpaired Student's t test; #p < 0.05 vs mean value under ALF in control mice; +p < 0.05 vs mean value under ALF in N-Bmal1−/− mice by paired Student's t test. For B–E, effects of genotype and time point, as well as interaction of genotype and time point, were all significant (p < 0.05) by two-way repeated-measures ANOVA. Values are mean ± SEM (n = 8 for control mice, closed circles; n = 6 for N-Bmal1−/− mice, open triangles).
Figure 4.
Figure 4.
Food-entrainable rhythms of Per1 and Per2 mRNA expression are attenuated in the brain of N-Bmal1−/− mice. A, Per1 and Per2 mRNA levels. Brains from control mice (black bars) and N-Bmal1−/− mice (white bars) were collected at CT20 and CT8 on the first day of food deprivation in DD following 7 d under RF in LD. Per1 and Per2 mRNA levels were determined by in situ hybridization. Data are expressed as percentage of mRNA level at CT8 in each region in control mice. *p < 0.05 for effect of sampling time point in each genotype and #p < 0.05 for effect of genotype by two-way factorial ANOVA followed by post hoc unpaired Student's t test. Values are mean ± SEM (n = 7 and 5 for control and N-Bmal1−/− mice, respectively at CT8, n = 4 and 3 at CT20). B, Representative images. Expression in the compact part of the DMH is indicated by white arrowhead. ec, External capsule; me, medial eminence; ml, molecular layer of the cerebral cortex; 3v, third ventricle. Scale bars, 200 μm.

References

    1. Acosta-Galvan G, Yi CX, van der Vliet J, Jhamandas JH, Panula P, Angeles-Castellanos M, Del Carmen Basualdo M, Escobar C, Buijs RM. Interaction between hypothalamic dorsomedial nucleus and the suprachiasmatic nucleus determines intensity of food anticipatory behavior. Proc Natl Acad Sci U S A. 2011;108:5813–5818. - PMC - PubMed
    1. Bunger MK, Walisser JA, Sullivan R, Manley PA, Moran SM, Kalscheur VL, Colman RJ, Bradfield CA. Progressive arthropathy in mice with a targeted disruption of the Mop3/Bmal-1 locus. Genesis. 2005;41:122–132. - PubMed
    1. Challet E, Mendoza J, Dardente H, Pévet P. Neurogenetics of food anticipation. Eur J Neurosci. 2009;30:1676–1687. - PubMed
    1. Damiola F, Le Minh N, Preitner N, Kornmann B, Fleury-Olela F, Schibler U. Restricted feeding uncouples circadian oscillators in peripheral tissues from the central pacemaker in the suprachiasmatic nucleus. Genes Dev. 2000;14:2950–2961. - PMC - PubMed
    1. Davidson AJ. Search for the feeding-entrainable circadian oscillator: a complex proposition. Am J Physiol Regul Integr Comp Physiol. 2006;290:R1524–R1526. - PubMed

Publication types

MeSH terms

LinkOut - more resources