. 2011 Oct 27:12:421.
doi: 10.1186/1471-2105-12-421.

Automated NMR relaxation dispersion data analysis using NESSY

Affiliations

Automated NMR relaxation dispersion data analysis using NESSY

Michael Bieri et al. BMC Bioinformatics. .

Abstract

Background: Proteins are dynamic molecules with motions ranging from picoseconds to longer than seconds. Many protein functions, however, appear to occur on the micro to millisecond timescale and therefore there has been intense research of the importance of these motions in catalysis and molecular interactions. Nuclear Magnetic Resonance (NMR) relaxation dispersion experiments are used to measure motion of discrete nuclei within the micro to millisecond timescale. Information about conformational/chemical exchange, populations of exchanging states and chemical shift differences are extracted from these experiments. To ensure these parameters are correctly extracted, accurate and careful analysis of these experiments is necessary.

Results: The software introduced in this article is designed for the automatic analysis of relaxation dispersion data and the extraction of the parameters mentioned above. It is written in Python for multi platform use and highest performance. Experimental data can be fitted to different models using the Levenberg-Marquardt minimization algorithm and different statistical tests can be used to select the best model. To demonstrate the functionality of this program, synthetic data as well as NMR data were analyzed. Analysis of these data including the generation of plots and color coded structures can be performed with minimal user intervention and using standard procedures that are included in the program.

Conclusions: NESSY is easy to use open source software to analyze NMR relaxation data. The robustness and standard procedures are demonstrated in this article.


Figures

Figure 1
Figure 1
The graphical user interface of NESSY. Data is imported into the interface of NESSY and analysis can be followed in real time in the Start Analysis section. Results are summarized and grouped in the Results and Summary section.
Figure 2
Figure 2
Comparison of fits of models 1 to 3 to synthetic data. (A) Individual fits of models 1 to 3 to the synthetic data for model 2 with 5% introduced error and (B) best fit (model 2). (C) Overview of fits (model 1 to 3) to synthetic data for model 3 with 5% introduced error. Best fit is displayed separately (D).
Figure 3
Figure 3
Analysis of 2 signals of PCTX1. Residue Trp 24 best fits to a slow exchange 2-state model, (model 3) (A and B), whereas Phe 30 was best described by a fast exchange 2-state model (model 2) (C and D).
Figure 4
Figure 4
Color coded structures created by PyMOL macros by NESSY. PCTX1 structure is color coded according to selected model (A) and kex (B). Note only 2 residues were analyzed and therefore, the majority of the structure is colored in black (no data). Different models are colored differently; increasing values are colored from yellow to red and line width is increased for increasing values of kex.
Figure 5
Figure 5
Global fit for synthetic data at 2 field strengths. Synthetic data for model 2 (A and B) and model 3 (C and D) were generated for two field strengths: 600 MHz (red and purple) and 800 MHz (blue and green). (A) Model 2 data was simultaneously fitted to models 1 to 3; only fits to models 2 and 3 are displayed. (B) Best selected model (model 2) is separately plotted. (C) Synthetic data of model 3 was fitted to models 1 to 3; only fits to models 2 and 3 are shown. (D) Best selected model (model 3) is separately plotted.
Figure 6
Figure 6
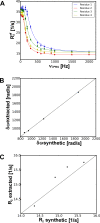
Cluster analysis. (A) Synthetic data for 4 residues in 2 state slow exchange (model 3) were created and simultaneously analyzed. (B and C) Correlation plots of extracted versus synthetic δω and R2, respectively.

References

    1. Grzesiek S, Sass HJ. From biomolecular structure to functional understanding: new NMR developments narrow the gap. Curr Opin Struct Biol. 2009;19(5):585–595. doi: 10.1016/j.sbi.2009.07.015. - DOI - PubMed
    1. Cabodi S, Di Stefano P, Leal Mdel P, Tinnirello A, Bisaro B, Morello V, Damiano L, Aramu S, Repetto D, Tornillo G. et al.Integrins and signal transduction. Adv Exp Med Biol. 2010;674:43–54. doi: 10.1007/978-1-4419-6066-5_5. - DOI - PubMed
    1. Johnson-Winters K, Tollin G, Enemark JH. Elucidating the catalytic mechanism of sulfite oxidizing enzymes using structural, spectroscopic, and kinetic analyses. Biochemistry. 2010;49(34):7242–7254. doi: 10.1021/bi1008485. - DOI - PMC - PubMed
    1. Tabernero L, Aricescu AR, Jones EY, Szedlacsek SE. Protein tyrosine phosphatases: structure-function relationships. FEBS J. 2008;275(5):867–882. doi: 10.1111/j.1742-4658.2008.06251.x. - DOI - PubMed
    1. Palmer AG. NMR probes of molecular dynamics: overview and comparison with other techniques. Annu Rev Biophys Biomol Struct. 2001;30:129–155. doi: 10.1146/annurev.biophys.30.1.129. - DOI - PubMed

Publication types

LinkOut - more resources