

Regional electric field induced by electroconvulsive therapy in a realistic finite element head model: influence of white matter anisotropic conductivity
- PMID: 22032945
- PMCID: PMC3495594
- DOI: 10.1016/j.neuroimage.2011.10.029
Regional electric field induced by electroconvulsive therapy in a realistic finite element head model: influence of white matter anisotropic conductivity
Abstract
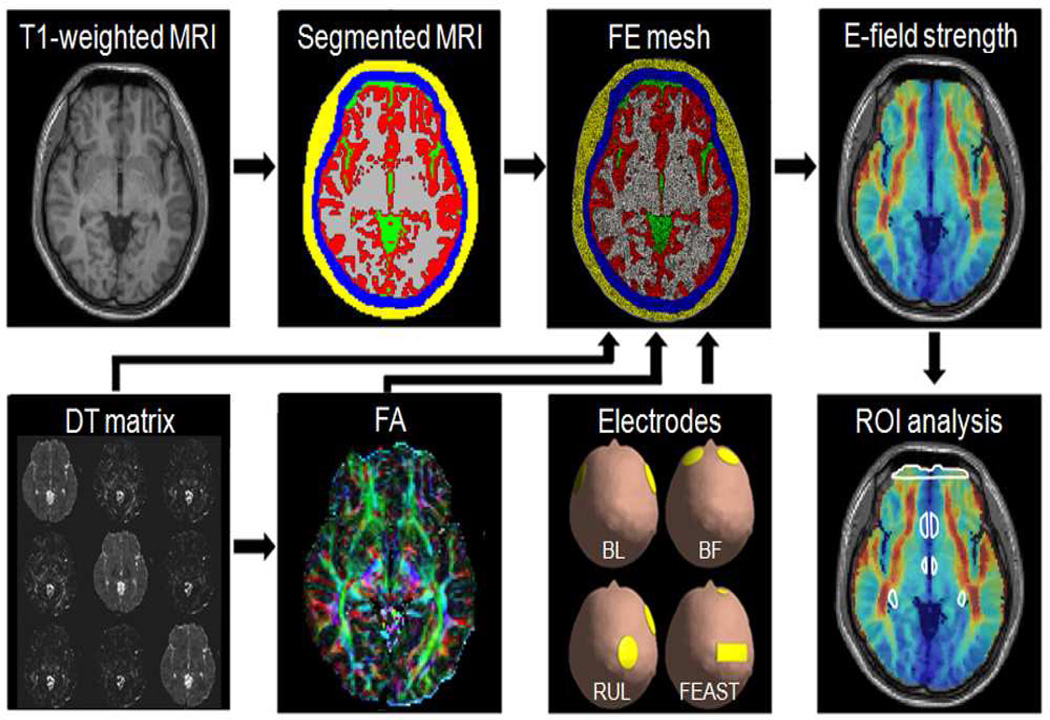
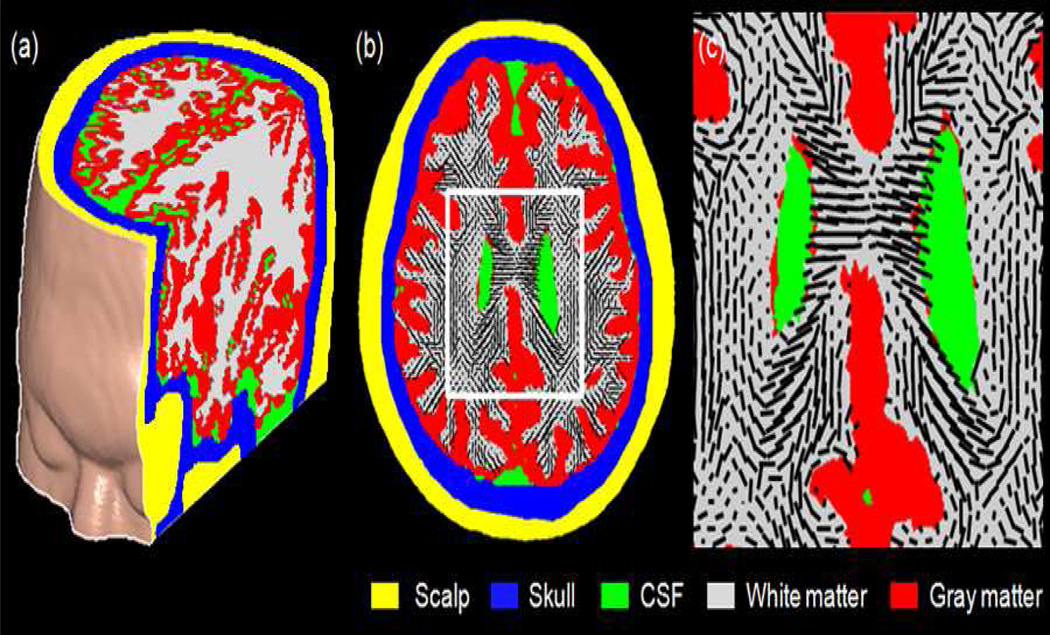
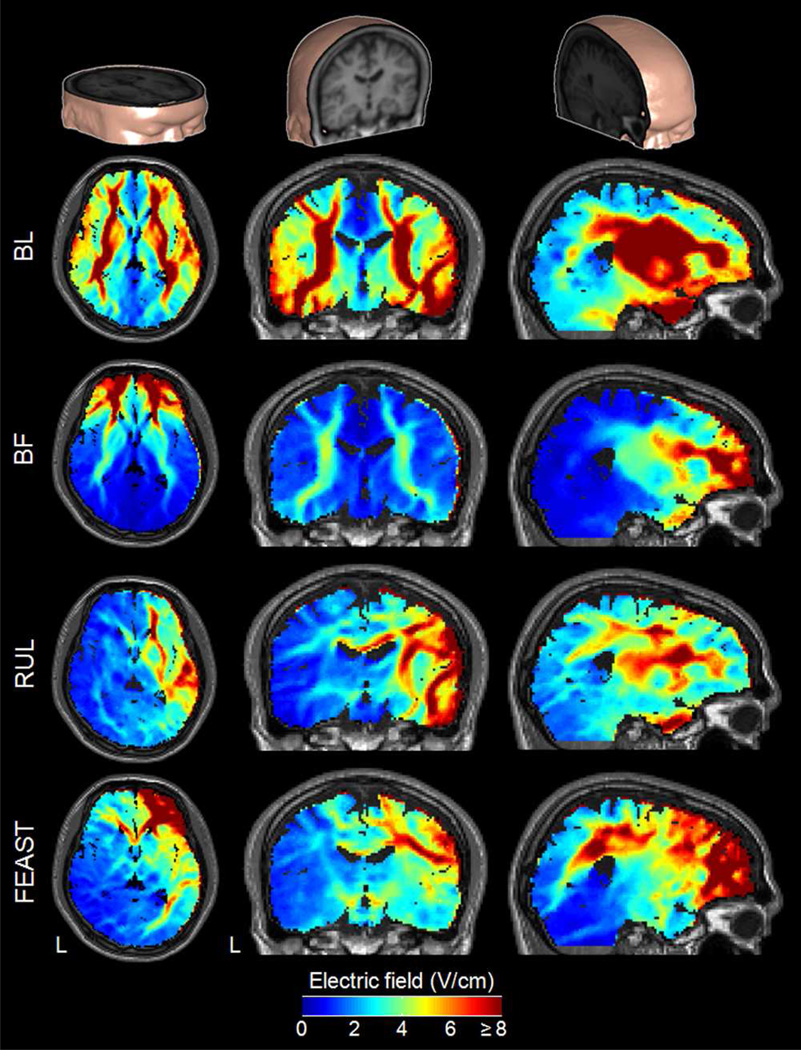
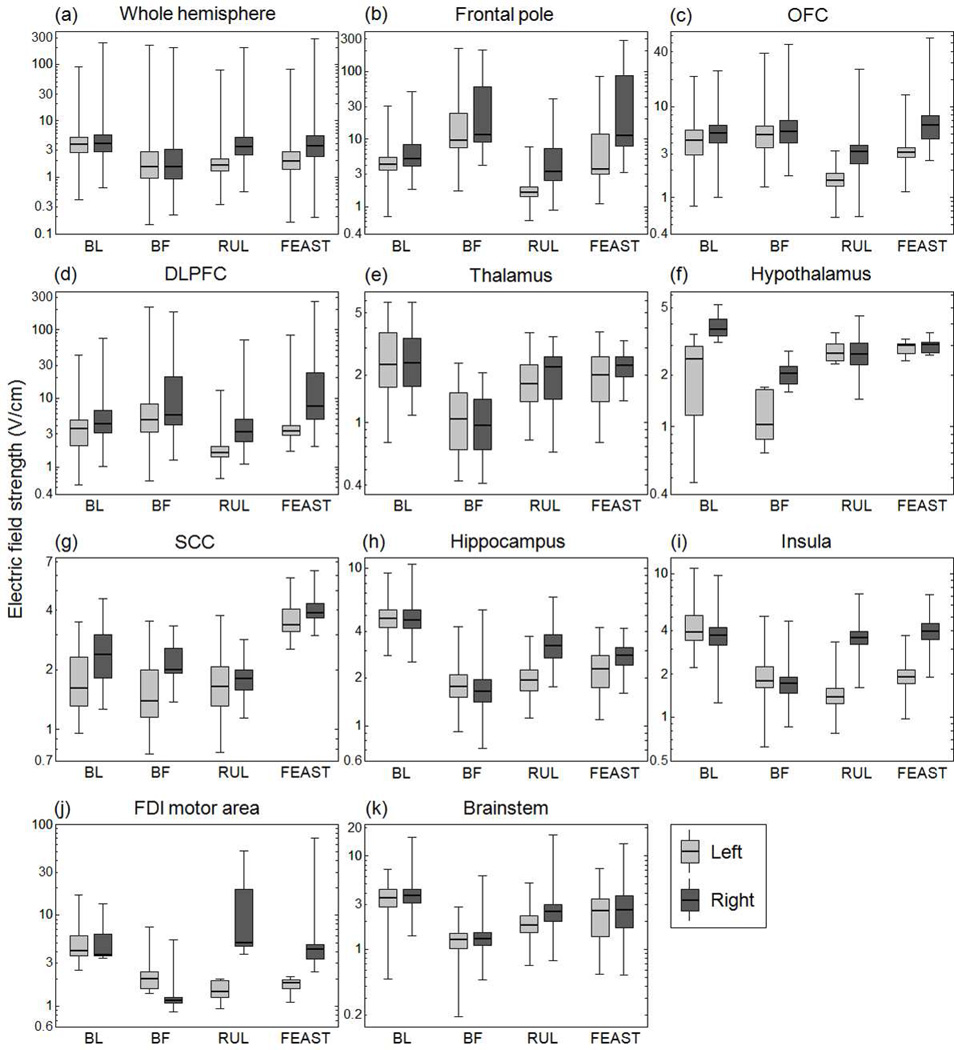
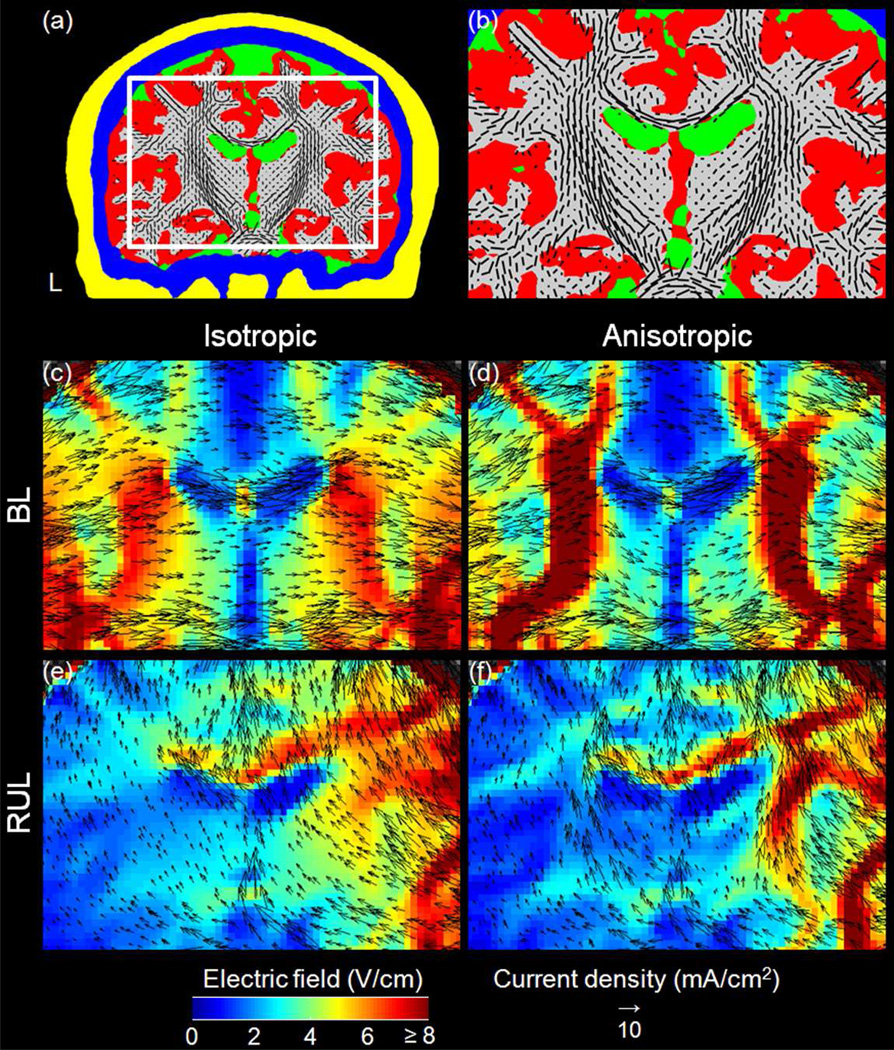
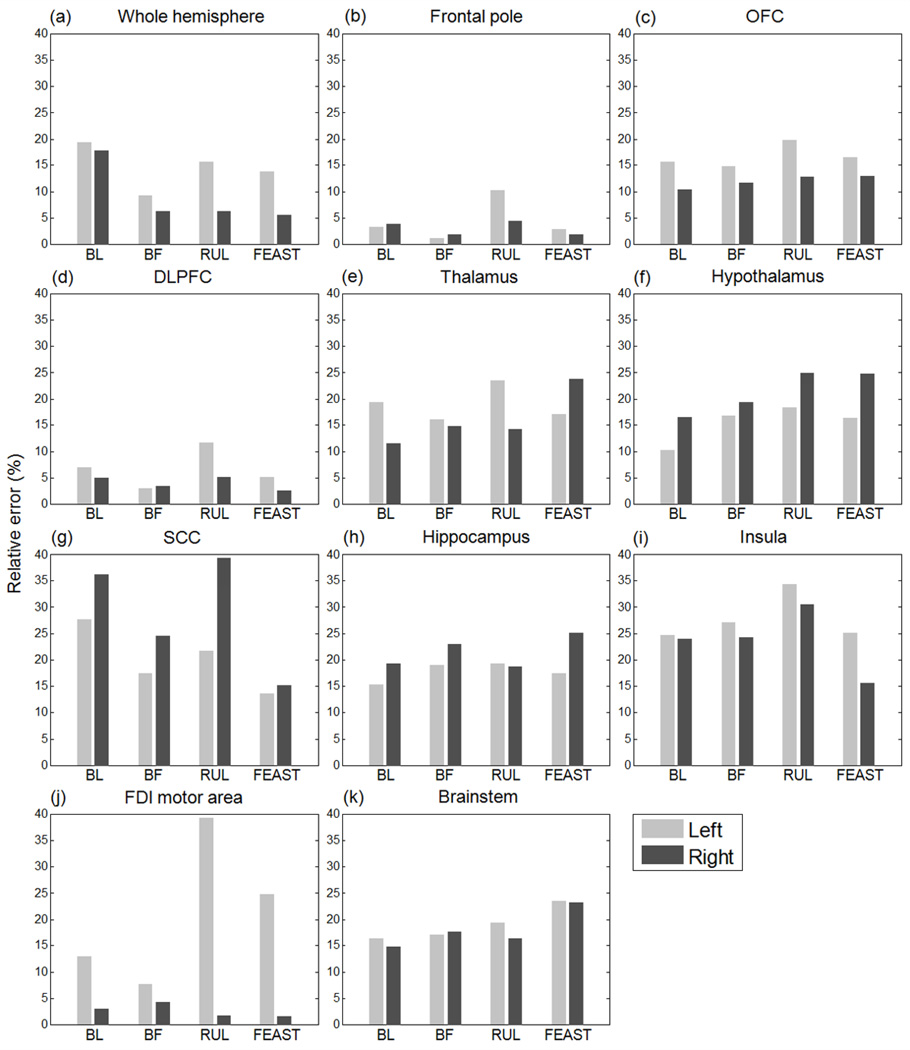
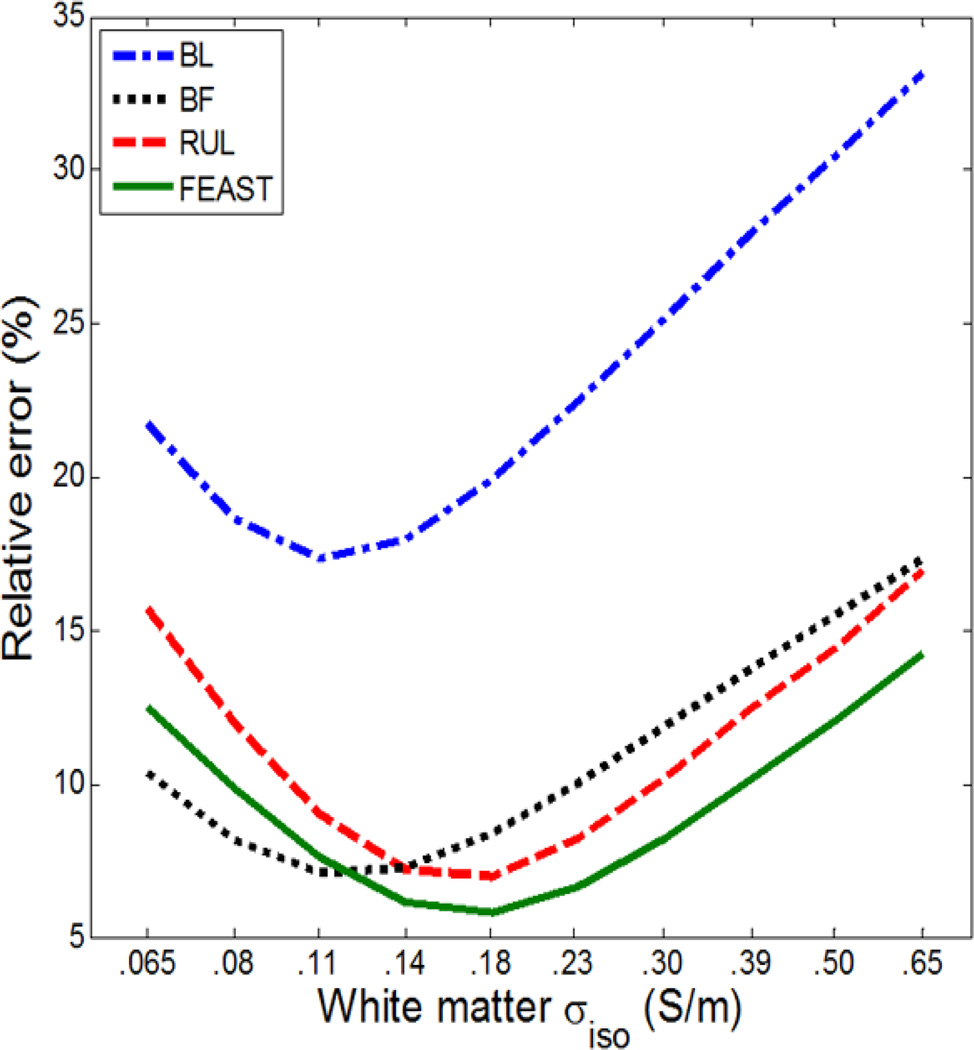
We present the first computational study investigating the electric field (E-field) strength generated by various electroconvulsive therapy (ECT) electrode configurations in specific brain regions of interest (ROIs) that have putative roles in the therapeutic action and/or adverse side effects of ECT. This study also characterizes the impact of the white matter (WM) conductivity anisotropy on the E-field distribution. A finite element head model incorporating tissue heterogeneity and WM anisotropic conductivity was constructed based on structural magnetic resonance imaging (MRI) and diffusion tensor MRI data. We computed the spatial E-field distributions generated by three standard ECT electrode placements including bilateral (BL), bifrontal (BF), and right unilateral (RUL) and an investigational electrode configuration for focal electrically administered seizure therapy (FEAST). The key results are that (1) the median E-field strength over the whole brain is 3.9, 1.5, 2.3, and 2.6 V/cm for the BL, BF, RUL, and FEAST electrode configurations, respectively, which coupled with the broad spread of the BL E-field suggests a biophysical basis for observations of superior efficacy of BL ECT compared to BF and RUL ECT; (2) in the hippocampi, BL ECT produces a median E-field of 4.8 V/cm that is 1.5-2.8 times stronger than that for the other electrode configurations, consistent with the more pronounced amnestic effects of BL ECT; and (3) neglecting the WM conductivity anisotropy results in E-field strength error up to 18% overall and up to 39% in specific ROIs, motivating the inclusion of the WM conductivity anisotropy in accurate head models. This computational study demonstrates how the realistic finite element head model incorporating tissue conductivity anisotropy provides quantitative insight into the biophysics of ECT, which may shed light on the differential clinical outcomes seen with various forms of ECT, and may guide the development of novel stimulation paradigms with improved risk/benefit ratio.
Copyright © 2011 Elsevier Inc. All rights reserved.
Figures
References
-
- Abascal JFPJ, Arridge SR, Atkinson D, Horesh R, Fabrizi L, De Lucia M, Horesh L, Bayford RH, Holder DS. Use of anisotropic modelling in electrical impedance tomography: description of method and preliminary assessment of utility in imaging brain function in the adult human head. Neuroimage. 2008;43:258–268. - PubMed
-
- Abrams R. Electroconvulsive therapy. 4th ed. New York: Oxford Unversity Press; 2002.
-
- Abrams R, Taylor MA. Diencephalic stimulation and the effects of ECT in endogenous depression. Br. J. Psychiatry. 1976;129:482–485. - PubMed
-
- Akhtari M, Bryant HC, Marnelak AN, Flynn ER, Heller L, Shih JJ, Mandelkern M, Matlachov A, Ranken DM, Best ED, DiMauro MA, Lee RR, Sutherling WW. Conductivities of three-layer live human skull. Brain Topography. 2002;14:151–167. - PubMed
-
- APA. Washington: American Psychiatric Association; 2001. The Practice of Electroconvulsive Therapy: Recommendations for Treatment, and Privileging: A Task Force Report of the American Psychiatric Association.
Publication types
MeSH terms
Grants and funding
LinkOut - more resources
Full Text Sources
Medical
Miscellaneous
