. 2012 Mar;46(3):389-96.
doi: 10.1165/rcmb.2011-0097OC. Epub 2011 Oct 27.

Effects of experimental asthma on inflammation and lung mechanics in sickle cell mice

Affiliations

Effects of experimental asthma on inflammation and lung mechanics in sickle cell mice

Kirkwood A Pritchard Jr et al. Am J Respir Cell Mol Biol. 2012 Mar.

Abstract

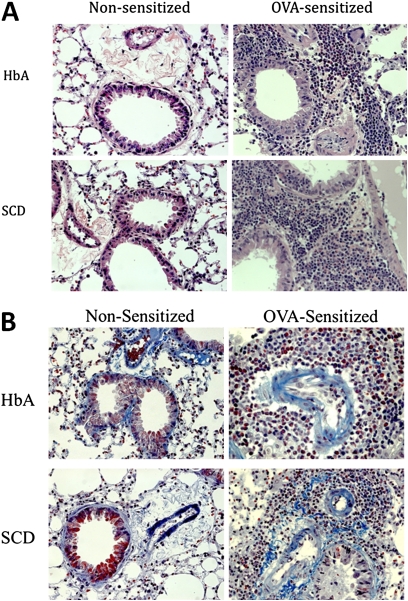
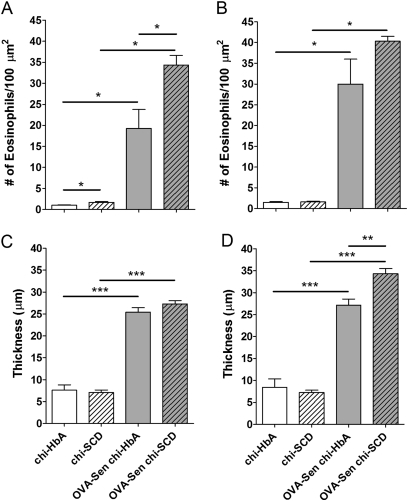
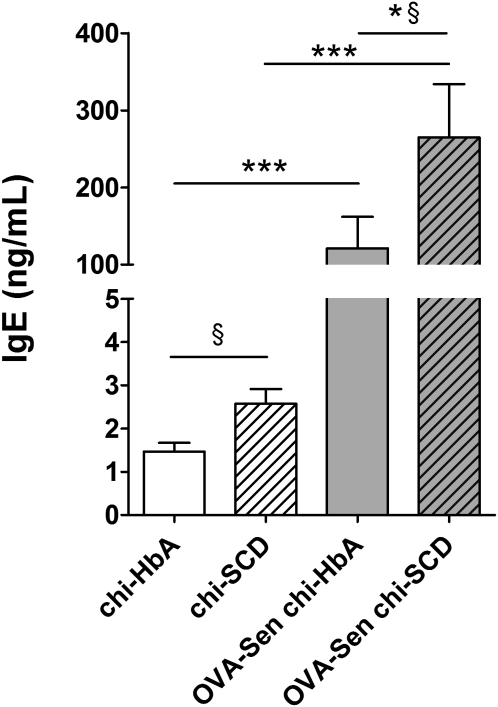
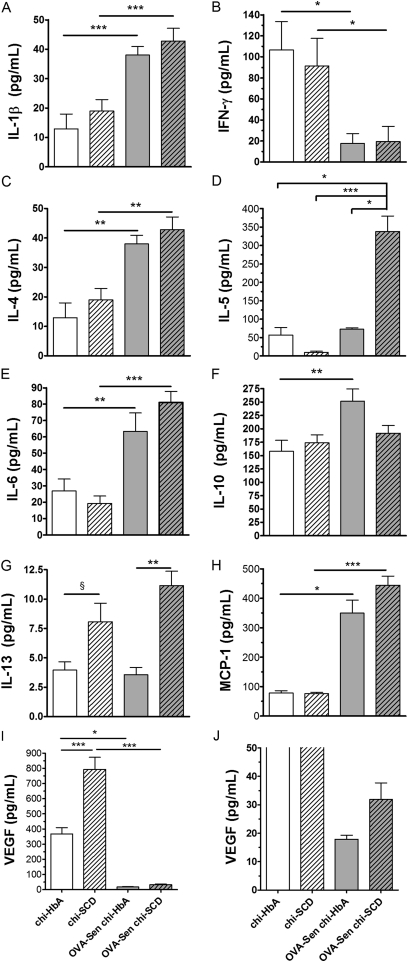
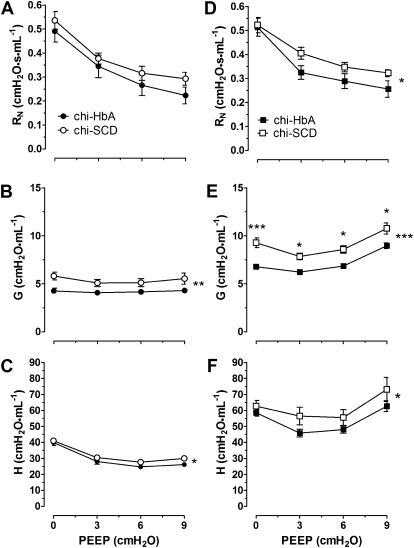
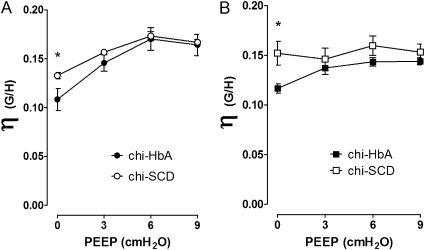
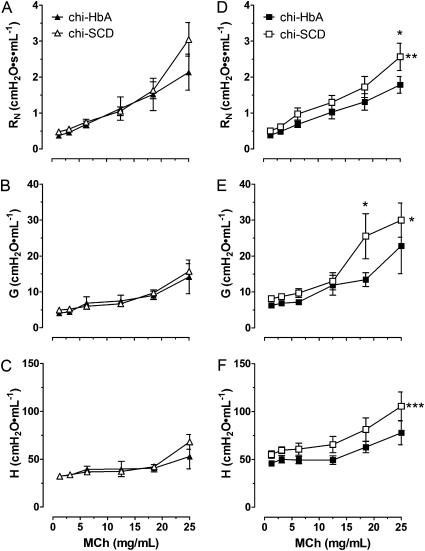
Experimental asthma increases eosinophil and collagen deposition in the lungs of sickle cell disease (SCD) mice to a greater extent than in control mice. However, the effects of asthma on inflammation and airway physiology remain unclear. To determine effects of asthma on pulmonary inflammation and airway mechanics in SCD mice, hematopoietic stem cell transplantation was used to generate chimeric SCD and hemoglobin A mice. Experimental asthma was induced by sensitizing mice with ovalbumin (OVA). Airway mechanics were assessed using forced oscillation techniques. Mouse lungs were examined histologically and physiologically. Cytokine, chemokine, and growth factors in bronchoalveolar lavage fluid were determined by multiplex. IgE was quantified by ELISA. LDH was quantified using a colorimetric enzymatic assay. At baseline (nonsensitized), chimeric SCD mice developed hemolytic anemia with sickled red blood cells, mild leukocytosis, and increased vascular endothelial growth factor and IL-13 compared with chimeric hemoglobin A mice. Experimental asthma increased perialveolar eosinophils, plasma IgE, and bronchoalveolar lavage fluid IL-1β, IL-4, IL-6, and monocyte chemotactic protein 1 in chimeric hemoglobin A and SCD mice. IFN-γ levels were reduced in both groups. IL-5 was preferentially increased in chimeric SCD mice but not in hemoglobin A mice. Positive end-expiratory pressures and methacholine studies revealed that chimeric SCD mice had greater resistance in large and small airways compared with hemoglobin A mice at baseline and after OVA sensitization. SCD alone induces a baseline lung pathology that increases large and small airway resistance and primes the lungs to increased inflammation and airway hyperresponsiveness after OVA sensitization.


Figures

Figure 1.
Figure 1.
Histology of lungs from nonsensitized (Non-Sen) and ovalbumin-sensitized (OVA-Sen) chimeric HbA and SCD mice. (A) Images showing H&E staining of eosinophil infiltration in the lungs of Non-Sen and OVA-Sen chimeric HbA and SCD mice. (B) Images showing McLetchie's trichrome staining for collagen in lungs of Non-Sen and OVA-Sen chi-HbA and chi-SCD mice.
Figure 2.
Figure 2.
Eosinophil counts and basement membrane thickness. Morphometric quantification of eosinophils (A, B) and basement membrane thickness (C, D) in lungs from nonsensitized and OVA-Sen chimeric HbA and SCD mice in the perialveolar (A, C) and perivascular regions (B, D) (n = 6 for each). Asterisks: significantly different from the indicated group (*P < 0.05, **P < 0.01, ***P < 0.001). Open bars, chi-HbA mice; hatched bars, chi-SCD mice; shaded bars, OVA-Sen chi-HbA mice; shaded hatched bars, OVA-Sen chi-SCD mice.
Figure 3.
Figure 3.
Total IgE. Total IgE was quantified by ELISA and values compared with known IgE standards. §P < 0.05 directed comparison of Non-Sen chi-HbA mice with Non-Sen chi-SCD mice and OVA-Sen chi-SCD mice with OVA-Sen chi-HbA mice. *P < 0.05, comparing OVA-Sen chi-SCD mice versus OVA-Sen chi-HbA mice. ***P < 0.001, comparing OVA-Sen chi-HbA mice versus Non-Sen chi-HbA mice and OVA-Sen chi-SCD mice versus Non-Sen chi-SCD mice (n = 7–12). Open bars, chi-HbA mice. Hatched bars. chi-SCD mice. Shaded bars, OVA-Sen chi-HbA mice. Shaded hatched bars, OVA-Sen chi-SCD mice.
Figure 4.
Figure 4.
Bronchoalveolar lavage fluid (BALF) cytokine, chemokine, and vascular endothelial growth factor (VEGF) studies. Bio-Plex quantification of IL-1β, IFN-γ, IL-4, IL5, IL-6, IL-10, Il-13, monocyte chemotactic protein (MCP)-1, and VEGF in BALF from Non-Sen and OVA-Sen chi-HbA and chi-SCD mice (n = 8–10). **P < 0.01. ***P < 0.001. Open bars, chi-HbA mice. Hatched bars, chi-SCD mice. Shaded bars, OVA-Sen chi-HbA mice. Shaded hatched bars, OVA-Sen chi-SCD mice.
Figure 5.
Figure 5.
Positive end-expiratory pressure (PEEP) studies. Indices of pulmonary mechanics using four levels of (0, 3, 6, and 9 cm H2O) in (A–C) Non-Sen and (D–F) OVA-Sen chi-HbA and chi-SCD mice. Closed circles, chi-HbA Non-Sen mice. Open circles, chi-SCD Non-Sen mice. Closed square, chi-HbA OVA-Sen mice. Open square, chi-SCD OVA-Sen mice. Significantly different from OVA-Sen chi-HbA mice at same level of PEEP (P < 0.02). The number of asterisks to the right of the curves indicates the levels of significance between the curves (*P < 0.05, **P < 0.01, ***P < 0.001).
Figure 6.
Figure 6.
Changes in hysteresisity (η = G/H), a sensitive measure of pulmonary resistance, in response to increasing PEEP levels. An increase in η suggests that lung is stiffer, resulting from increased collagen deposition and/or a greater number of alveolae becoming filled with fluid. The η curves were generated by dividing G data by H data in Figure 5 and plotting the result against the four increasing levels of PEEP (0, 3, 6, and 9 cm H2O). Closed circles, chi-HbA Non-Sen mice. Open circles, chi-SCD Non-Sen mice. Closed squares, chi-HbA OVA-Sen mice. Open squares, chi-SCD OVA-Sen mice. *P < 0.05.
Figure 7.
Figure 7.
Airway responses to aerosolized methacholine in nonsensitized and OVA-sensitized chimeric HbA and SCD mice. Closed triangles, chi-HbA nonsensitized mice. Open triangles, chi-SCD nonsensitized mice. Closed squares, chi-HbA OVA-sensitized mice. Open squares, chi-SCD OVA-sensitized mice. *Significantly different from nonsensitized mice at the same dosage of methacholine (P < 0.05). Significantly different from chi-HbA mice at the same dosage of methacholine (P < 0.05). The number of asterisks to the right of the curves indicates the levels of significance between the curves. (*P < 0.05, **P < 0.01, ***P < 0.001).

References

    1. Steinberg MH. Sickle cell anemia, the first molecular disease: overview of molecular etiology, pathophysiology, and therapeutic approaches. ScientificWorldJournal 2008;8:1295–1324 - PMC - PubMed
    1. Knight-Madden JM, Forrester TS, Lewis NA, Greenough A. Asthma in children with sickle cell disease and its association with acute chest syndrome. Thorax 2005;60:206–210 - PMC - PubMed
    1. Boyd JH, Macklin EA, Strunk RC, DeBaun MR. Asthma is associated with acute chest syndrome and pain in children with sickle cell anemia. Blood 2006;108:2923–2927 - PMC - PubMed
    1. Boyd JH, Moinuddin A, Strunk RC, DeBaun MR. Asthma and acute chest in sickle-cell disease. Pediatr Pulmonol 2004;38:229–232 - PubMed
    1. Sylvester KP, Patey RA, Broughton S, Rafferty GF, Rees D, Thein SL, Greenough A. Temporal relationship of asthma to acute chest syndrome in sickle cell disease. Pediatr Pulmonol 2007;42:103–106 - PubMed

Publication types

MeSH terms