

Cancer incidence in the United Kingdom: projections to the year 2030
- PMID: 22033277
- PMCID: PMC3242594
- DOI: 10.1038/bjc.2011.430
Cancer incidence in the United Kingdom: projections to the year 2030
Abstract
Background: Projections of cancer incidence are important for planning health services and to provide a baseline for assessing the impact of public health interventions.
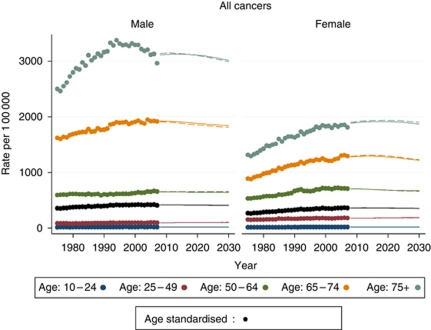
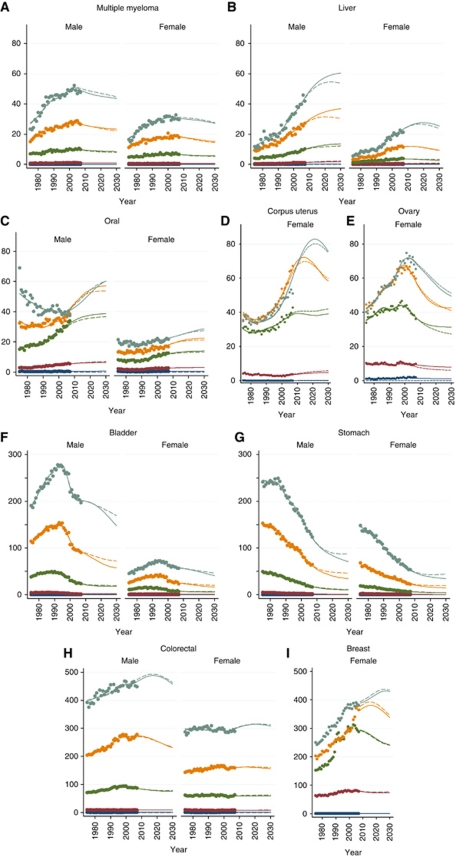
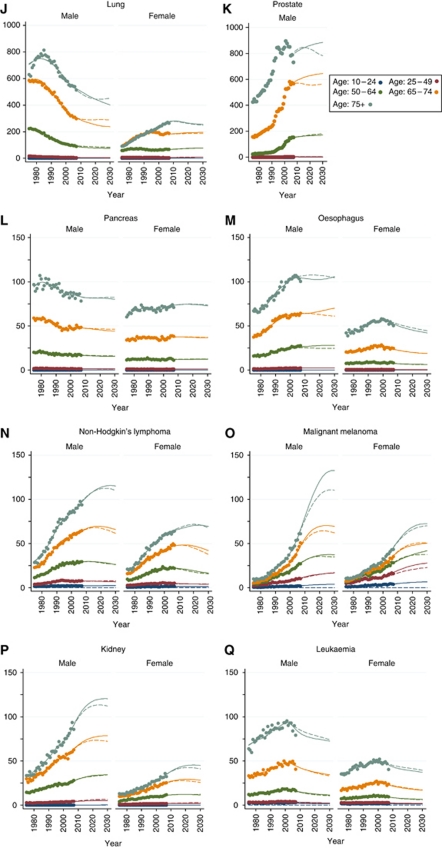
Methods: Rates estimated from smooth function age-period-cohort modelling of cancer incidence data from Great Britain 1975 to 2007 are extrapolated to 2030 and applied to UK population projections. Prostate and breast cancer projections take into account the effect of screening.
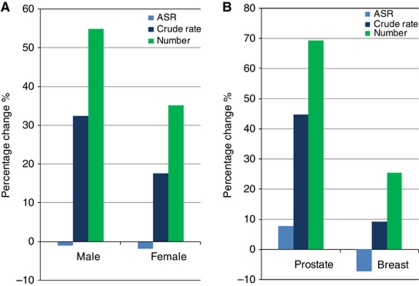
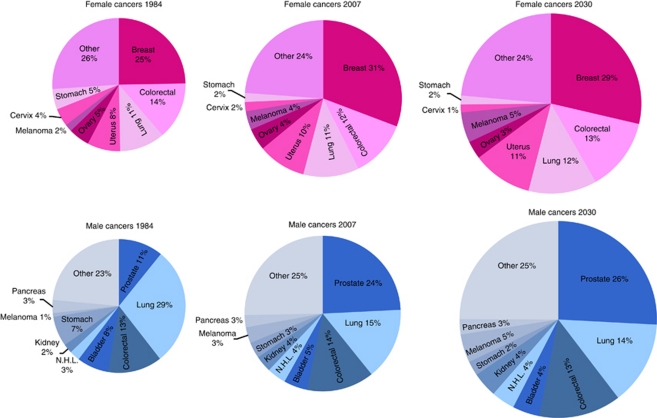
Results: Overall rates of cancer are projected to be stable over the next 20 years, but this masks individual changes. In both sexes, age-standardised rates of cancers of the stomach, larynx, bladder and leukaemia are projected to fall by ≥1% per year, whereas cancers of the lip, mouth and pharynx (ICD-10 C00-C14) and melanoma are projected to increase by ≥1% per year. The growing and aging populations will have a substantial impact: numbers of cancers in men and women are projected to increase by 55% (from 149,169 to 231,026) and 35% (from 148,716 to 200,929), respectively, between 2007 and 2030. The model used yields similar results to those of Nordpred, but is more flexible.
Conclusion: Without new initiatives for smoking and obesity reduction, the number of cancers in the United Kingdom will increase substantially reflecting the growing and aging populations.
Figures
Comment in
-
Reply to 'comment on cancer incidence in the United Kingdom: projections to the year 2030'.Br J Cancer. 2013 Mar 19;108(5):1215-7. doi: 10.1038/bjc.2013.72. Epub 2013 Feb 21. Br J Cancer. 2013. PMID: 23429208 Free PMC article. No abstract available.
-
Comment on 'cancer incidence in the United Kingdom: projections to the year 2030'.Br J Cancer. 2013 Mar 19;108(5):1213-4. doi: 10.1038/bjc.2013.71. Epub 2013 Feb 21. Br J Cancer. 2013. PMID: 23429209 Free PMC article. No abstract available.
References
-
- Bray F, Møller B (2006) Predicting the future burden of cancer. Nat Rev Cancer 6(1): 63–74 - PubMed
-
- Brewster DH, Fraser LA, Harris V, Black RJ (2000) Rising incidence of prostate cancer in Scotland: increased risk or increased detection? BJU Int 85(4): 463–472; discussion 472–3 - PubMed
-
- Carstensen B (2007) Age-period-cohort models for the Lexis diagram. Stat Med 26: 3018–3045 - PubMed
-
- Hastie TJ, Tibshirani RJ (1990) Generalized Additive Models. Chapman & Hall/CRC, ISBN 9780412343902.
-
- Møller B, Fekjaer H, Hakulinen T, Tryggvadottir L, Storm HH, Talback M, Haldorsen T (2002) Prediction of cancer incidence in the Nordic countries up to the year 2020. Eur J Cancer Prev 11(Suppl 1): S1–96 - PubMed
Publication types
MeSH terms
Grants and funding
LinkOut - more resources
Full Text Sources
