. 2011 Nov 25;334(6059):1129-33.
doi: 10.1126/science.1206727. Epub 2011 Oct 27.

Pretreatment mitochondrial priming correlates with clinical response to cytotoxic chemotherapy

Affiliations

Pretreatment mitochondrial priming correlates with clinical response to cytotoxic chemotherapy

Triona Ni Chonghaile et al. Science. .

Abstract

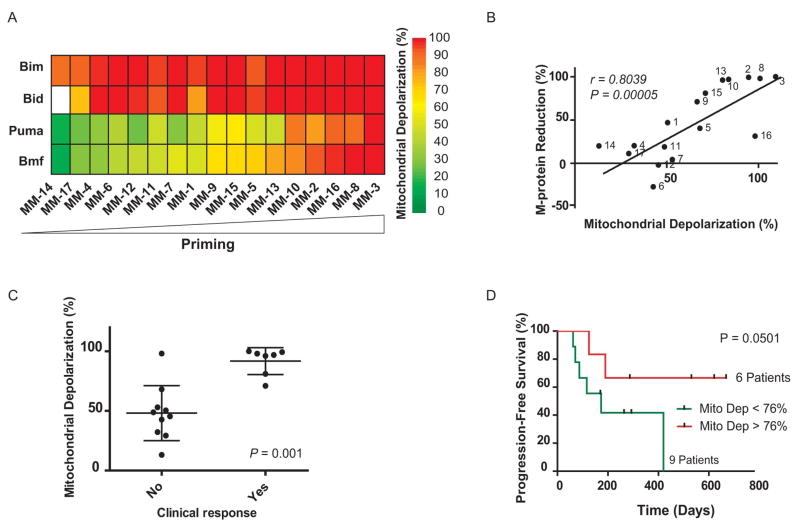
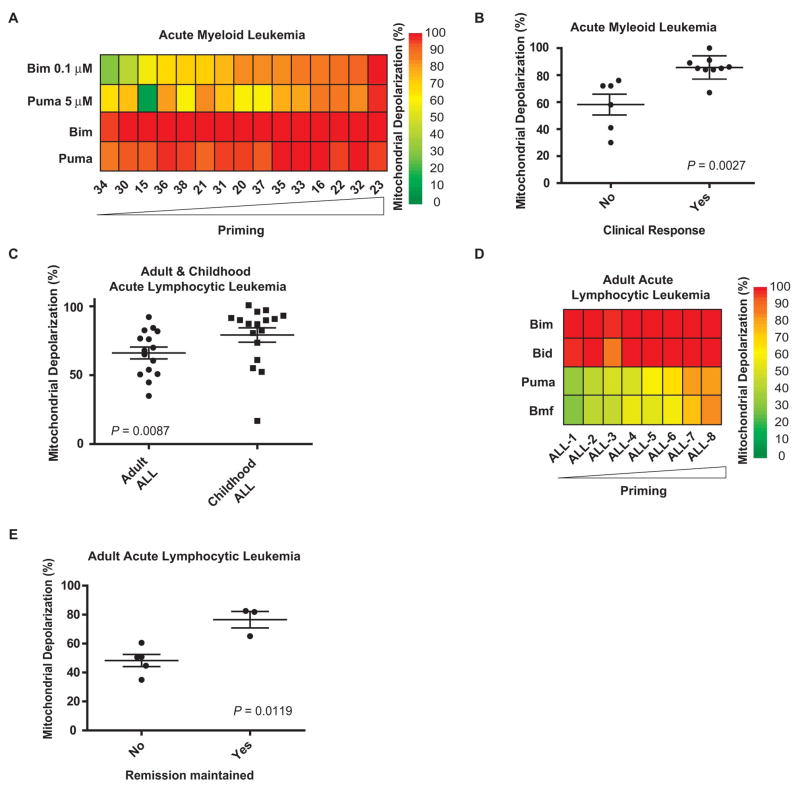
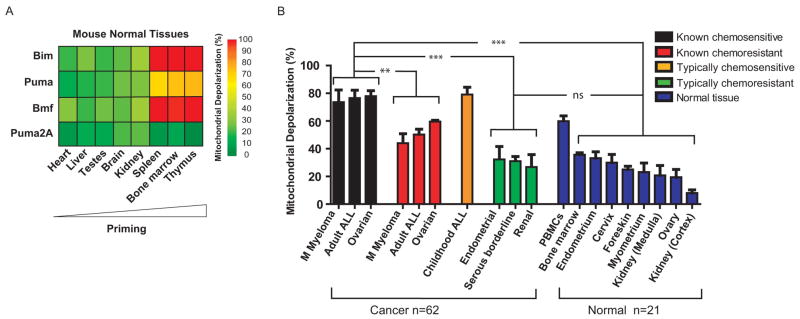
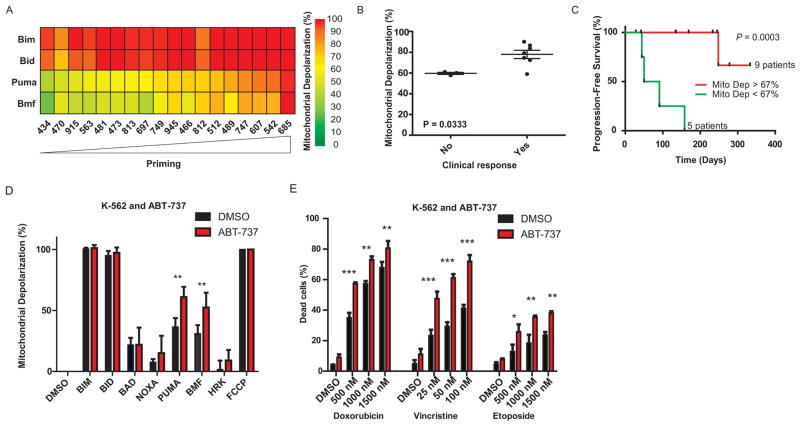
Cytotoxic chemotherapy targets elements common to all nucleated human cells, such as DNA and microtubules, yet it selectively kills tumor cells. Here we show that clinical response to these drugs correlates with, and may be partially governed by, the pretreatment proximity of tumor cell mitochondria to the apoptotic threshold, a property called mitochondrial priming. We used BH3 profiling to measure priming in tumor cells from patients with multiple myeloma, acute myelogenous and lymphoblastic leukemia, and ovarian cancer. This assay measures mitochondrial response to peptides derived from proapoptotic BH3 domains of proteins critical for death signaling to mitochondria. Patients with highly primed cancers exhibited superior clinical response to chemotherapy. In contrast, chemoresistant cancers and normal tissues were poorly primed. Manipulation of mitochondrial priming might enhance the efficacy of cytotoxic agents.


Figures

Fig. 1
Fig. 1
Mitochondrial priming correlates with clinical response to chemotherapy in multiple myeloma. (A) Heat map of mitochondrial depolarization caused by the BIM, BID, PUMA and BMF peptides (measurements of “priming”) in bone marrow samples from 17 patients with multiple myeloma. Individual patient codes are shown along the x axis and samples are ordered according to increasing depolarization by the BMF peptide. Unless indicated otherwise, the concentration of peptide in the assays was 100 μM. Data shown are the mean of 2–3 replicate wells for each peptide. (B) Mitochondrial depolarization caused by the BMF peptide in myeloma patient samples compared with percent reduction in serum level of M-protein, a biomarker of disease burden in multiple myeloma. Each point is labeled with patient code. (C) Mitochondrial depolarization caused by BMF peptide in myeloma patients that were grouped according to their clinical response (see supplementary methods). (D) Patients with highly primed myeloma exhibited superior progression-free survival.
Fig. 2
Fig. 2
Mitochondrial priming correlates with clinical response to chemotherapy in AML and ALL. (A) Heat map of mitochondrial depolarization caused by BIM (0.1 and 100 μM) and PUMA (5 and 100 μM) peptides in malignant myeloblasts from bone marrow aspirates of 15 AML patients. Samples are ordered according to increased depolarization by BIM (0.1 μM) peptide. (B) Mitochondrial depolarization caused by BIM (0.1 μM) peptide in AML samples that were grouped according to their clinical response (see supplementary methods). (C) Mitochondrial depolarization caused by PUMA peptide in primary lymphoblasts from bone marrow aspirates of 15 adult and 17 pediatric ALL patients. (D) Heat map of mitochondrial depolarization caused by BIM, BID, PUMA and BMF peptides in primary lymphoblasts from bone marrow aspirates of 8 adult ALL patients with clinical follow-up. Samples are ordered according to increased depolarization by PUMA peptide. (E) Mitochondrial depolarization caused by PUMA peptide in primary lymphoblasts from bone marrow aspirates of 8 adult ALL patients grouped according to whether clinical remission was maintained.
Fig. 3
Fig. 3
Analysis of mitochondrial priming and clinical response in ovarian cancer ](A) to (C)] and analysis of the effect of in vitro perturbation of priming on chemosensitivity of a leukemia cell line [(D) and (E)]. (A) Heat map of mitochondrial depolarization caused by the BIM, BID, PUMA, AND BMF peptides in 18 primary ovarian tumors. Samples are ordered according to increased depolarization by PUMA peptide. (B) Mitochondrial depolarization caused by PUMA peptide in primary ovarian tumors from 10 patients in which CA-125 values remained elevated after surgery and prior to start of chemotherapy. Patients are grouped according to clinical response to chemotherapy (normalization of CA-125). (C) Patients with highly primed ovarian tumors exhibited superior progression-free survival. (D) Mitochondrial depolarization response to BH3 peptides (BH 3 profile) for the K-562 leukemia cell line with and without pretreatment with 2 μM ABT-737 treatment for 16hr. DMSO is a solvent negative control and the ionophore FCCP is a positive control for depolarization. (E) Assessment of cell viability (Annexin V/Propidium Iodide (PI) staining) in K-562 cell line following pretreatment with ABT-737 (mean ± s.d, n = 2) and 48 hour treatment with indicated compounds.
Fig. 4
Fig. 4
Low mitochondrial priming in normal mouse and human cells correlates with resistance to chemotherapy. (A) Heat map of mitochondrial depolarization caused by the BIM, PUMA, BMF, and PUMA2A peptides in normal murine tissues. Tissues are ordered according to increased depolarization by PUMA peptide. PUMA2A is a double alanine substituted (loss of function) PUMA peptide serving as a negative control to establish background signal. (B) Comparison of mitochondrial priming among all primary human cancers and normal tissues in this paper. The cancers with clinical follow-up were classified as known chemosensitive or known chemoresistant. Cancers classified as typically chemoresistant (Serous borderline n = 3, Endometrial n = 3 and Renal n = 3) (fig. S14) or typically chemosensitive (childhood ALL n = 17) lacked individual clinical follow-up data. Data shown are mean ± s.d. across all specimens tested. ANOVA was used to demonstrate statistical significance between the different categories with a Tukey’s multiple comparison post test. ns - P value > 0.05; **P value < 0.01 and ***P value < 0.001.

Comment in

References

    1. Skipper HE. Cancer. 1971;28:1479. - PubMed
    1. Bosch F, et al. Clin Cancer Res. 2008;14:155. - PubMed
    1. Marcus R, et al. Blood. 2005;105:1417. - PubMed
    1. Noguchi S. Cancer Sci. 2006;97:813. - PMC - PubMed
    1. Pasieka JL. Curr Opin Oncol. 2003;15:78. - PubMed

Publication types

MeSH terms

Substances