

Neuroplasticity in mood disorders
- PMID: 22033747
- PMCID: PMC3181795
- DOI: 10.31887/DCNS.2004.6.2/wdrevets
Neuroplasticity in mood disorders
Abstract
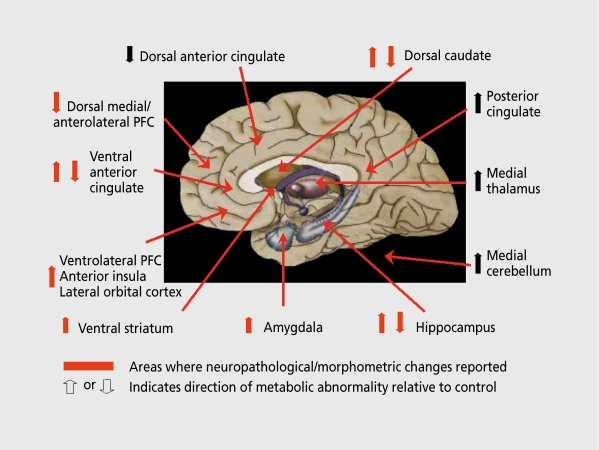
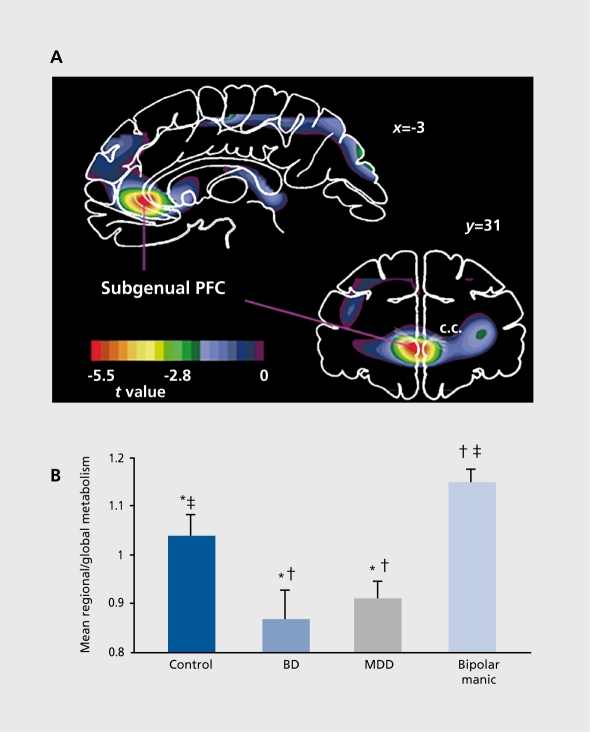
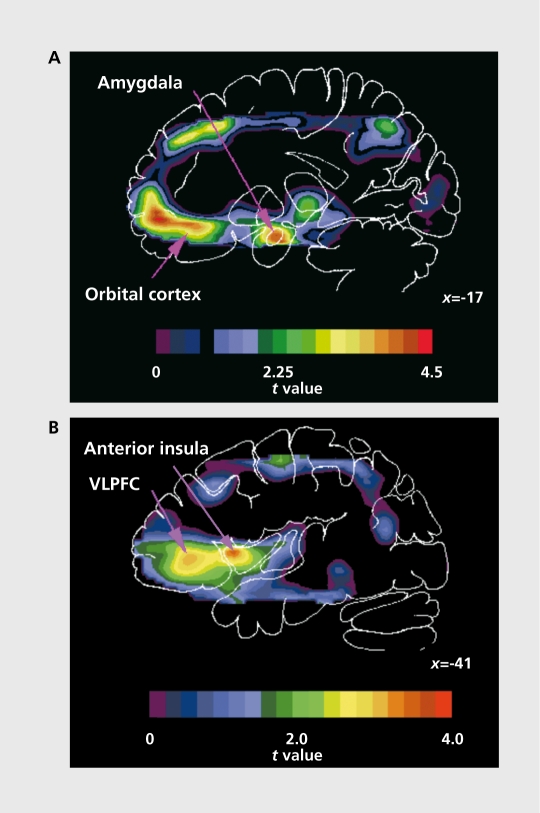
Neuroimaging and neuropathological studies of major depressive disorder (MDD) and bipolar disorder (BD) have identified abnormalities of brain structure in areas of the prefrontal cortex, amygdala, striatum, hippocampus, parahippocampal gyrus, and raphe nucleus. These structural imaging abnormalities persist across illness episodes, and preliminary evidence suggests they may in some cases arise prior to the onset of depressive episodes in subjects at high familial risk for MDD. In other cases, the magnitude of abnormality is reportedly correlated with time spent depressed. Postmortem histopathological studies of these regions have shown abnormal reductions of synaptic markers and glial cells, and, in rare cases, reductions in neurons in MDD and BD. Many of the regions affected by these structural abnormalities show increased glucose metabolism during depressive episodes. Because the glucose metabolic signal is dominated by glutamatergic transmission, these data support other evidence that excitatory amino acid transmission is elevated in limbic-cortical-striatal-pallidal-thalamic circuits during depression. Some of the subject samples in which these metabolic abnormalities have been demonstrated were also shown to manifest abnormally elevated stressed plasma cortisol levels. The co-occurrence of increased glutamatergic transmission and Cortisol hypersecretion raises the possibility that the gray matter volumetric reductions in these depressed subjects are partly accounted for by processes homologous to the dendritic atrophy induced by chronic stress in adult rodents, which depends upon interactions between elevated glucocorticoid secretion and N-meihyl-D-aspartate (NMDA)-glutamate receptor stimulation. Some mood-stabilizing and antidepressant drugs that exert neurotrophic effects in rodents appear to reverse or attenuate the gray matter volume abnormalities in humans with mood disorders. These neurotrophic effects may be integrally related to the therapeutic effects of such agents, because the regions affected by structural abnormalities in mood disorders are known to play major roles in modulating the endocrine, autonomic, behavioral, and emotional experiential responses to stressors.
Los estudios neuropatológicos y de neuroimágenes en la depresión mayor (DM) y en el trastorno bipolar (TB) han identificado anormalidades de la estructura cerebral en áreas de la corteza prefrontal, la amígdala, el cuerpo estriado, el hipocampo, el giro parahipocámpico y el núcleo del rafe. Estas anormalidades estructurales en las neuroimágenes se mantienen más allá de los episodios de la enfermedad y las evidencias preliminares sugieren que en algunos casos ellas pueden aparecer antes del inicio de los episodios depresivos en sujetos con alto riesgo familiar de DM. En otros casos, la magnitud de la anormalidad se correlaciona con el tiempo que lleva la depresión. Estudios histopatológicos postmortem de estas regiones han mostrado disminuciones anormales de marcadores sinápticos y de células gliales y, en raros casos, disminución de neuronas en la DM y el TB. Muchas de las regiones afectadas por estas alteraciones estructurales muestran un aumento del metabolismo de la glucosa durante los episodios depresivos. Dado que la señal metabólica de glucosa está comandada por la transmisión glutamatérgica, estos datos sustentan el argumento a favor del incremento de la transmisión del aminoácido excitatorio en los circuitos límbico-córtico-estriato-pálido-talámicos durante la depresión. Algunos de los sujetos de las muestras en que se encontraron estas anormalidades metabólicas también tuvieron cifras elevadas de cortisol plasmático en respuesta al estrés. La aparición concomitante del aumento de la transmisión glutamatérgica y de la hipersecreción de cortisol incrementa la probabilidad que las disminuciones del volumen de sustancia gris en los sujetos con depresión se deba en parte a los procesos equivalentes a los de la atrofia dendrítica inducida por el estrés crónico en roedores adultos, lo que depende de las interacciones entre el aumento de la secreción de glucocorticoides y la estimulación del receptor de glutamato N-metil-D-aspártico (NMDA). Algunos antidepresivos y estabilizadores del ánimo que ejercen efectos neurotróficos en roedores parece que revierten o disminuyen las anormalidades del volumen de sustancia gris en humanos con trastornos afectivos. Estos efectos neurotróficos pueden estar relacionados integramente con los efectos terapéuticos de dichos fármacos, ya que se sabe que las regiones afectadas por alteraciones estructurales en los trastornos afectivos tienen un papel importante en la modulación de las respuestas endocrina, autonómica, conductual y emocional que se experimenta frente al estrés.
Les études de neuropathologie et de neuro-imagerie des troubles dépressifs majeurs (TDM) et des troubles bipolaires (TB) ont identifié des anomalies de la structure cérébrale dans les aires du cortex prefrontal, de l'amygdale, du striatum, de l'hippocampe, du gyrus parahippocampique et du noyau du raphé. Ces anomalies structurelles à l'image persistent à travers les épisodes de la maladie et des arguments antérieurs suggèrent qu'elles peuvent se produire avant l'apparition des épisodes dépressifs chez les sujets à haut risque familial de TDM. Dans d'autres cas, l'importance des anomalies serait liée à la durée de la dépression. Des études histopathologiques post mortem de ces régions ont montré des réductions anormales des marqueurs synaptiques et des cellules gliales et, dans quelques rares cas, des diminutions du nombre des neurones dans les TDM et les TB. De nombreuses régions atteintes par ces anomalies structurelles présentent un métabolisme du glucose augmenté pendant ces épisodes dépressifs, La transmission glutamatergique dominant le signal métabolique du glucose, ces données confortent un autre argument à savoir que la transmission de l'acide aminé excitateur est élevée dans les circuits limbiques-corticaux-striataux-pallidaux-thalamiques pendant la dépression. Certains échantillons, chez des sujets chez qui on a trouvé des anomalies métaboliques, ont également montré des concentrations anormalement élevées de Cortisol plasmatique en réponse au stress. L'apparition concomitante de l'augmentation de la transmission glutamatergique et de l'hypersécrétion de Cortisol accroît la possibilité que les réductions de volume de la substance grise chez ces personnes dépressives soient en partie justifiées par des processus identiques à ceux de l'atrophie dendritique induite par le stress chronique chez les rongeurs adultes, qui dépend des interactions entre la sécrétion élevée des glu cocorticoïdes et la stimulation du récepteur glutamatergique N-méthyl-D-aspartate (NMDA). Certains médicaments antidépresseurs et thymorégulateurs exerçant des effets neurotrophiques chez les rongeurs semblent inverser ou atténuer les anomalies du volume de la substance grise chez les humains atteints de troubles de l'humeur. Ces effets neurotrophiques peuvent être intégralement liés aux effets thérapeutiques de tels médicaments, parce qu'il est reconnu que les régions affectées par des anomalies structurelles au cours des troubles de l'humeur jouent un rôle majeur dans la modulation des réponses aux agents stressants au niveau de l'expérience endocrine, autonome, comportementale et émotionnelle.
Keywords: bipolar disorder; major depressive disorder; neuro-imaging abnormalities; neuroplasticity; postmortem studies.
Figures
References
-
- Drevets WC., Gadde K., Krishnan R. Neuroimaging studies of depression. In: Charney DS, Nestler EJ, Bunney BJ, eds. The Neurobiological Foundation of Mental Illness. 2nd ed. New York, NY: Oxford University Press. 2004:461–490.
-
- Raichle ME. Circulatory and metabolic correlates of brain function in normal humans. In: Brookhart JM, Mountcastle VB, eds. Handbook of Physiology The Nervous System. Baltimore, Md: American Physiology Society. 1987;5:643–674.
-
- DiRocco RJ., Kageyama GH., Wong-Riley MT. The relationship between CNS metabolism and cytoarchitecture: a review of 14C-deoxyglucose studies with correlation to cytochrome oxidase histochemistry. Comput Med imaging Graph. 1989;13:81–92. - PubMed
LinkOut - more resources
Full Text Sources