. 2011 Dec 16;286(50):42981-91.
doi: 10.1074/jbc.M111.310599. Epub 2011 Oct 27.

TLR2 and RIP2 pathways mediate autophagy of Listeria monocytogenes via extracellular signal-regulated kinase (ERK) activation

Affiliations

TLR2 and RIP2 pathways mediate autophagy of Listeria monocytogenes via extracellular signal-regulated kinase (ERK) activation

Paras K Anand et al. J Biol Chem. .

Abstract

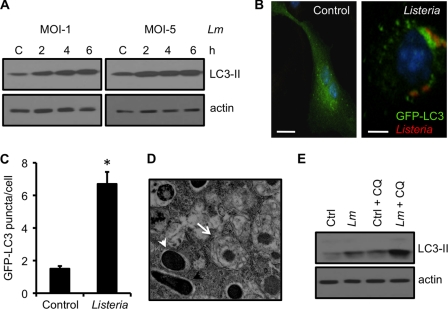
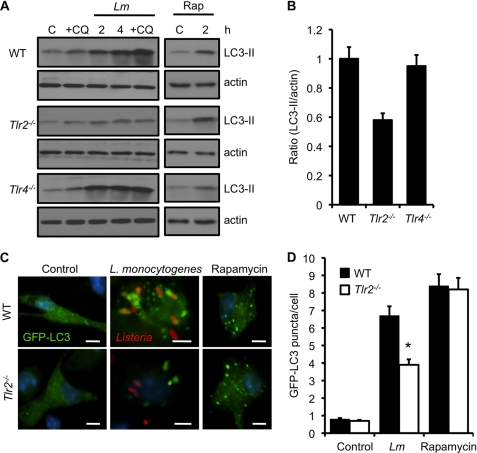
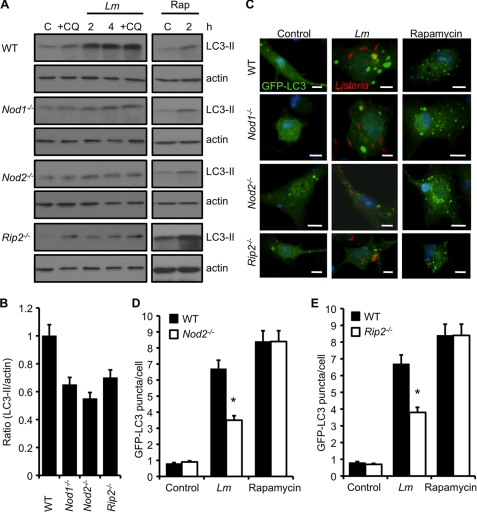
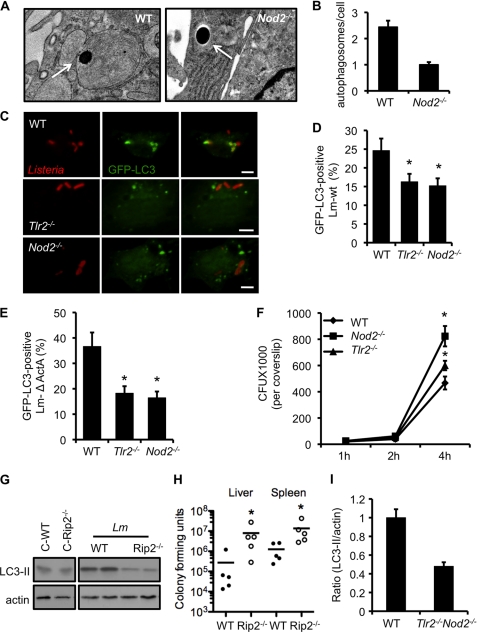
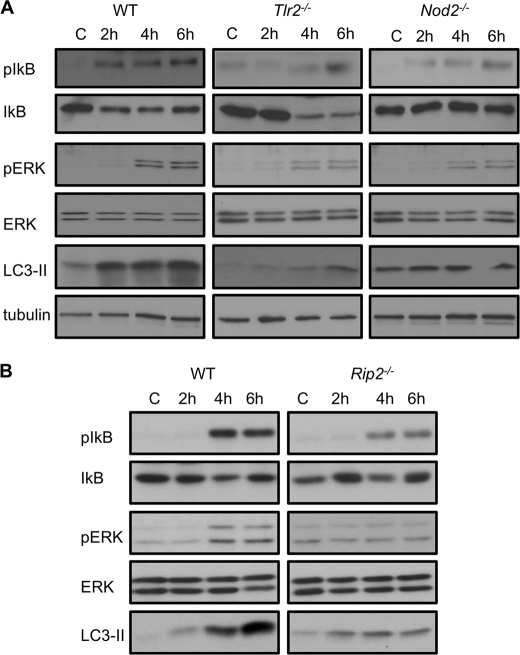
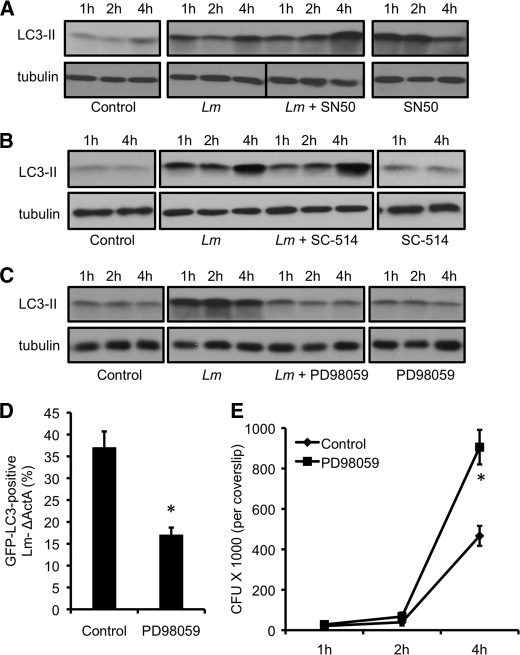
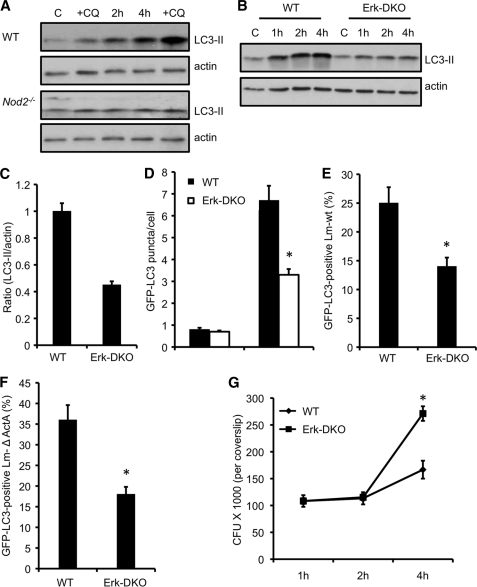
Listeria monocytogenes is a facultative intracellular pathogen that invades both phagocytic and non-phagocytic cells. Recent studies have shown that L. monocytogenes infection activates the autophagy pathway. However, the innate immune receptors involved and the downstream signaling pathways remain unknown. Here, we show that macrophages deficient in the TLR2 and NOD/RIP2 pathway display defective autophagy induction in response to L. monocytogenes. Inefficient autophagy in Tlr2(-/-) and Nod2(-/-) macrophages led to a defect in bacteria colocalization with the autophagosomal marker GFP-LC3. Consequently, macrophages lacking TLR2 and NOD2 were found to be more susceptible to L. monocytogenes infection, as were the Rip2(-/-) mice. Tlr2(-/-) and Nod2(-/-) cells showed perturbed NF-κB and ERK signaling. However, autophagy against L. monocytogenes was dependent selectively on the ERK pathway. In agreement, wild-type cells treated with a pharmacological inhibitor of ERK or ERK-deficient cells displayed inefficient autophagy activation in response to L. monocytogenes. Accordingly, fewer bacteria were targeted to the autophagosomes and, consequently, higher bacterial growth was observed in cells deficient in the ERK signaling pathway. These findings thus demonstrate that TLR2 and NOD proteins, acting via the downstream ERK pathway, are crucial to autophagy activation and provide a mechanistic link between innate immune receptors and induction of autophagy against cytoplasm-invading microbes, such as L. monocytogenes.


Figures

FIGURE 1.
FIGURE 1.
L. monocytogenes infection induces autophagy in bone marrow-derived macrophages. A, Western blot analyses of LC3-II in macrophages either uninfected (C) or infected with L. monocytogenes (Lm) either at a multiplicity of infection of 1:1 or 5:1. Actin was used as a loading control. B and C, confocal microscope images of macrophages nucleofected with the GFP-LC3 plasmid and either uninfected (control) or infected with L. monocytogenes. At 4 h, cells were fixed and analyzed for the number of autophagosomes per cell as shown in C. Scale bars = 10 μm. Values represent mean ± S.E. *, p ≤ 0.05. D, cells infected as described above were fixed in 2.5% gluteraldehyde and processed for transmission electron microscopy. L. monocytogenes, either within an autophagosome (arrow) or free in the cytoplasm (arrowheads) are indicated. E, Western blot analyses of cells infected as described above. At 30 min, a set of control and L. monocytogenes-infected cells were incubated with chloroquine. The lysates were prepared 4 h after infection. Results are representative of three separate experiments.
FIGURE 2.
FIGURE 2.
TLR2 is required for autophagy activation upon L. monocytogenes infection. A, Western blot analyses of LC3-II in WT, Tlr2−/−, or Tlr4−/− macrophages that were uninfected (C), infected with L. monocytogenes (Lm) for different periods (in the presence or absence of CQ), or incubated with rapamycin (Rap) (50 μg/ml) for 2 h. Actin was used as a loading control. B, densitometry scanning of the blots showing the ratio of LC3-II to actin in wild-type, Tlr2−/−, or Tlr4−/− macrophages at 4 h. The graph is a representation of three different blots. C, confocal microscope images of WT or TLR2-deficient macrophages transfected with the GFP-LC3 plasmid and uninfected (control), infected with L. monocytogenes for 4 h, or treated with rapamycin (50 μg/ml) for 2 h. Scale bars = 10 μm. D, quantification of the number of GFP-LC3 puncta per cell 4 h after infection as described in C. Results show mean ± S.E. (*, p ≤ 0.05) of experiments done at least three times.
FIGURE 3.
FIGURE 3.
NOD1 and NOD2 are required for autophagy activation upon L. monocytogenes infection. A, Western blot analyses of LC3-II in WT, Nod1−/−, Nod2−/−, or Rip2−/− macrophages that were uninfected (C), infected with L. monocytogenes (Lm) for different periods (in the presence or absence of CQ), or incubated with rapamycin (Rap) (50 μg/ml) for 2 h. Actin was used as a loading control. B, densitometry scanning of the blot showing the ratio of LC3-II to actin in wild-type, Nod1−/−, Nod2−/−, or Rip2−/− macrophages at 4 h. The graph is a representation of three different blots. C, confocal microscope images of WT, NOD1-, NOD2-, or RIP2-deficient macrophages transfected with the GFP-LC3 plasmid. Cells were uninfected, infected with L. monocytogenes for 4 h, or treated with rapamycin (50 μg/ml) for 2 h. Scale bars = 10 μm. D and E, quantification of the number of GFP-LC3 puncta per cell at 4 h post-infection in Nod2−/− macrophages or Rip2−/− macrophages (E) when infected as described in C. Results show mean ± S.E. (*, p ≤ 0.05) of experiments done at least three times.
FIGURE 4.
FIGURE 4.
Tlr2−/− and Nod2−/− macrophages sequester fewer L. monocytogenes within autophagosomes. A, electron micrograph of WT and NOD2-deficient macrophages infected with L. monocytogenes. Arrows denote L. monocytogenes either within the autophagosome (left panel) or free in the cytosol (right panel). B, quantification of the number of autophagosomes per cell in macrophages infected as described in A. C, confocal microscope images of GFP-LC3 autophagosomes and Listeria from WT, Tlr2−/−, and Nod2−/− cells 4 h after infection. Scale bars = 10 μm. D, quantification of the GFP-LC3-positive L. monocytogenes wild-type strain in cells infected as described in C. E, quantification of the GFP-LC3-positive Listeria mutant lacking ActA in cells infected as described in C. F, intracellular growth curve of L. monocytogenes in wild-type, Tlr2−/−, and Nod2−/− macrophages. *, p ≤ 0.05. G, wild-type and Rip2−/− mice were infected with 3 × 10⁵ L. monocytogenes. The Western blot analysis shows LC3-II expression in liver homogenates from WT and Rip2−/−-infected mice at day 3 of infection. Actin was used as a loading control. H, wild-type and Rip2−/− mice were infected as described in F. Bacterial loads were determined in liver and spleen at day 3 after infection. Data represent the mean ± S.E. of three independent experiments. *, p ≤ 0.05. I, densitometry scanning of the Western blot analysis showing the ratio of LC3-II to actin in wild-type and Tlr2−/−Nod2−/− macrophages infected with L. monocytogenes at 4 h. The graph is a representation of three different blots.
FIGURE 5.
FIGURE 5.
TLR2−/− and Nod2−/− macrophages show defective NF-κB and ERK1/2 signaling upon Listeria infection. A, Western blots of pIκB, IκB, pERK, ERK, and LC3-II in WT, TLR2-, and NOD2-deficient macrophages that were uninfected (C) or infected with L. monocytogenes for different periods. Tubulin was used as a loading control. B, Western blot analyses of pIκB, IκB, pERK, ERK, and LC3-II in WT and RIP2-deficient macrophages that were uninfected (C) or infected with L. monocytogenes for different periods.
FIGURE 6.
FIGURE 6.
Autophagy of L. monocytogenes is dependent on the ERK signaling pathway. A, Western blot analyses of LC3-II in wild-type macrophages left uninfected (control), infected with L. monocytogenes in the absence or presence of NF-κB inhibitor SN50, or treated with SN50 alone. Tubulin was used as a loading control. B, Western blot analyses of LC3-II in wild-type macrophages left uninfected (control), infected with L. monocytogenes in the absence or presence of NF-κB inhibitor SC-514, or treated with SC-514 alone. Tubulin was used as a loading control. C, Western blots of LC3-II in wild-type macrophages left uninfected (control), infected with L. monocytogenes in the absence or presence of the ERK inhibitor (PD98059), or treated with the inhibitor alone. Tubulin was used as a loading control. D, quantification of GFP-LC3 positive Listeria ActA mutant in wild-type cells in the absence or presence of the ERK inhibitor. *, p ≤ 0.05. E, intracellular growth curve of the L. monocytogenes ActA mutant in wild-type cells in the absence or presence of the ERK inhibitor. *, p ≤ 0.05.
FIGURE 7.
FIGURE 7.
Cells deficient in ERK signaling display defective autophagy of L. monocytogenes. A, Western blot analyses of LC3-II in wild-type and Nod2−/− dendritic cells infected with L. monocytogenes. At 30 min, a set of control and L. monocytogenes-infected cells were incubated with CQ. Results are representative of three separate experiments. B, Western blot analyses of LC3-II in wild-type and Erk1−/−;Erk2fl/fl;CD11c-Cre (ERK-DKO) DCs infected with L. monocytogenes. Results are representative of three separate experiments. C, densitometry scanning of the Western blot analysis showing the ratio of LC3-II to actin in wild-type and ERK-DKO DCs infected with L. monocytogenes 4 h after infection. D, quantification of the number of GFP-LC3 puncta per cell 4 h after infection in wild-type and ERK-DKO DCs. Results show mean ± S.E. (*, p ≤ 0.05) of experiments done at least three times. E, quantification of the GFP-LC3-positive L. monocytogenes wild-type strain in cells infected as described in C. Results show mean ± S.E. (*, p ≤ 0.05) of experiments done at least three times. F, quantification of theGFP-LC3-positive Listeria mutant lacking ActA in cells infected as described in C. Results show mean ± S.E. (*, p ≤ 0.05) of experiments done at least three times. G, intracellular growth curve of L. monocytogenes ΔActA in wild-type and ERK-DKO DCs. *, p ≤ 0.05.

References

    1. Vázquez-Boland J. A., Kuhn M., Berche P., Chakraborty T., Domínguez-Bernal G., Goebel W., González-Zorn B., Wehland J., Kreft J. (2001) Clin. Microbiol. Rev. 14, 584–640 - PMC - PubMed
    1. Corr S. C., O'Neill L. A. (2009) Cell Microbiol. 11, 703–709 - PubMed
    1. Ireton K. (2007) Cell Microbiol. 9, 1365–1375 - PubMed
    1. Mengaud J., Ohayon H., Gounon P., Mege R. M., Cossart P. (1996) Cell 84, 923–932 - PubMed
    1. Hamon M., Bierne H., Cossart P. (2006) Nat. Rev. Microbiol. 4, 423–434 - PubMed

Publication types

MeSH terms

Substances