. 2012 Jan;32(1):92-102.
doi: 10.1161/ATVBAHA.111.238618. Epub 2011 Oct 27.

In vivo functional and transcriptional profiling of bone marrow stem cells after transplantation into ischemic myocardium

Affiliations

In vivo functional and transcriptional profiling of bone marrow stem cells after transplantation into ischemic myocardium

Ahmad Y Sheikh et al. Arterioscler Thromb Vasc Biol. 2012 Jan.

Abstract

Objective: Clinical trials of bone marrow-derived stem cell therapy for the heart have yielded variable results. The basic mechanism(s) that underlies their potential efficacy remains unknown. In the present study, we evaluated the survival kinetics, transcriptional response, and functional outcome of intramyocardial bone marrow mononuclear cell (BMMC) transplantation for cardiac repair in a murine myocardial infarction model.

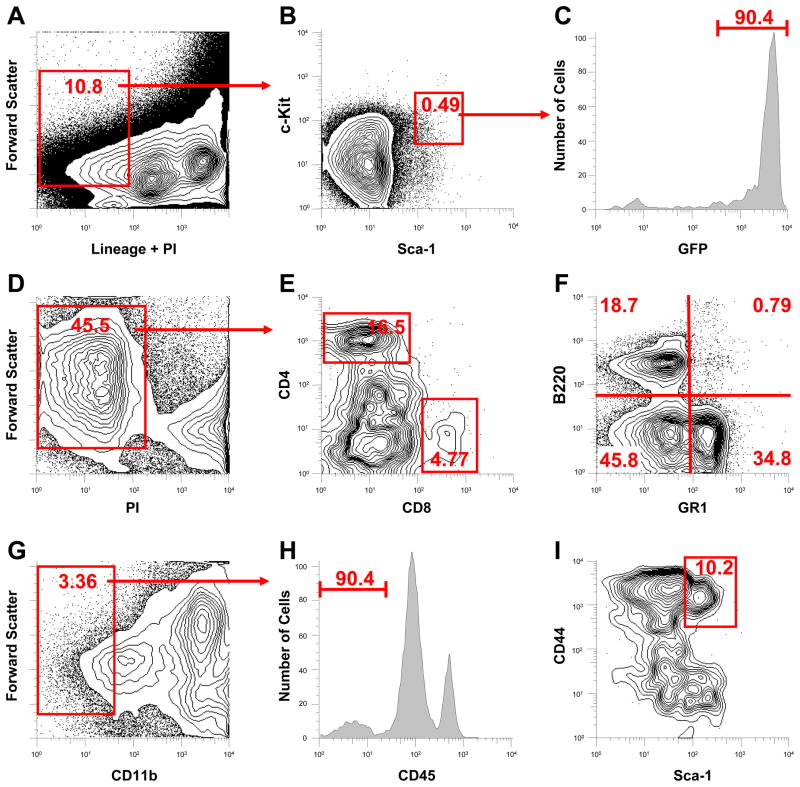
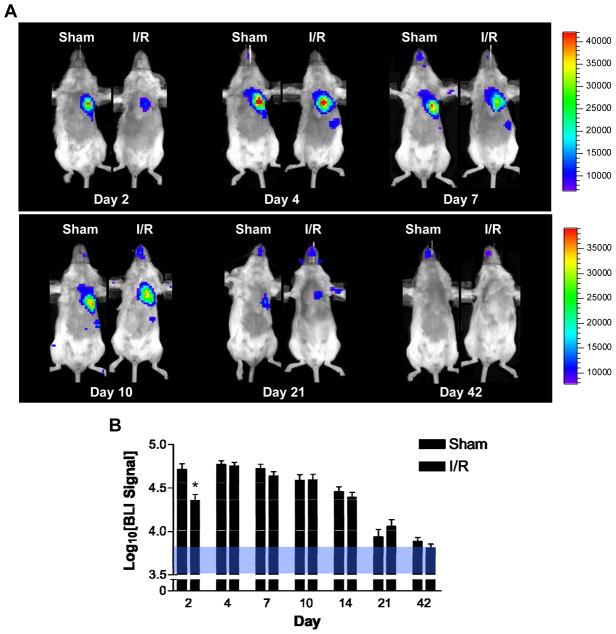
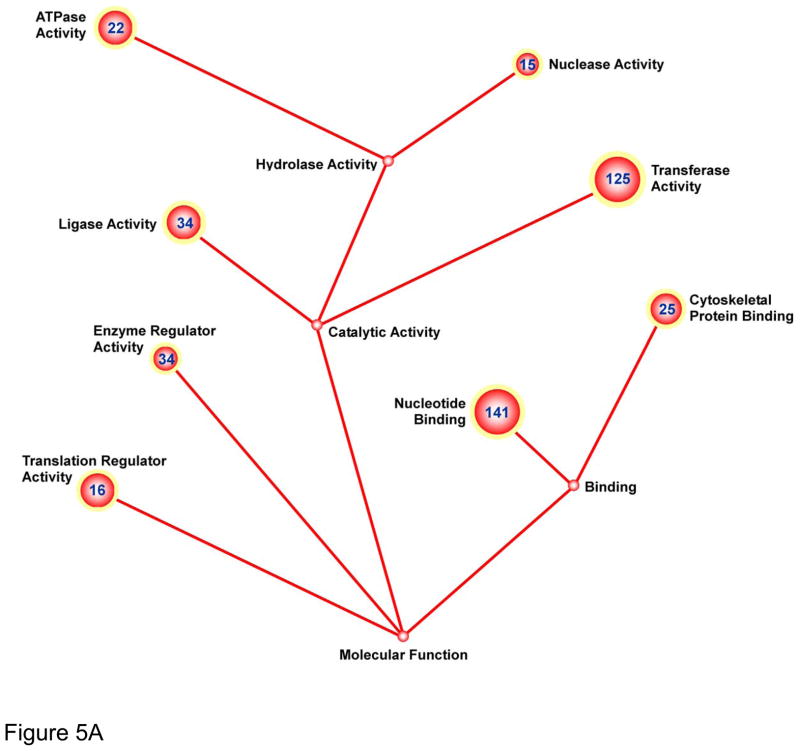
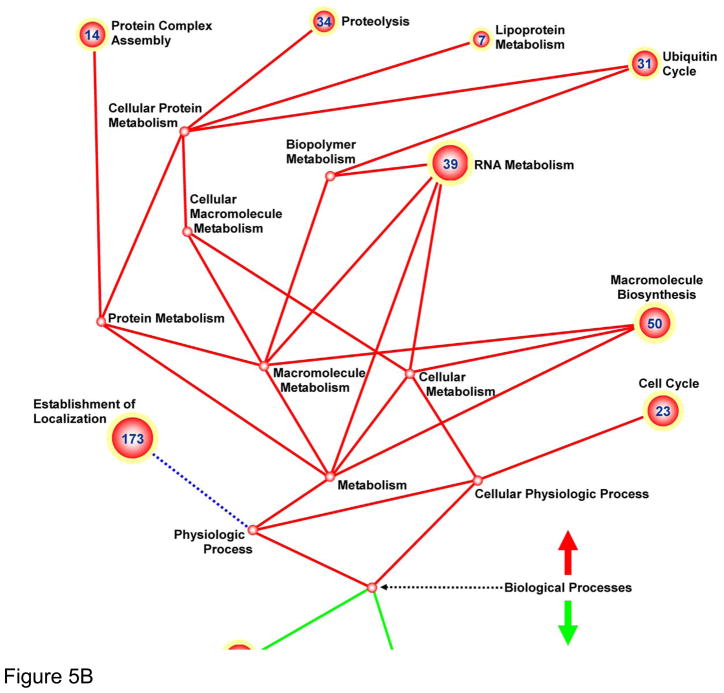
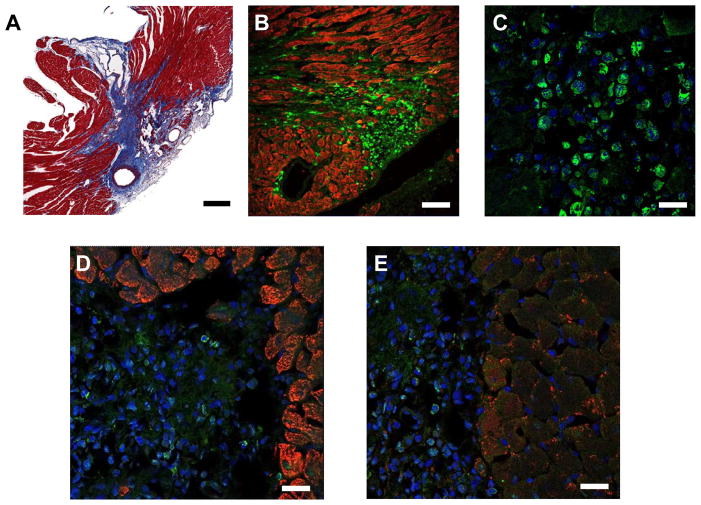
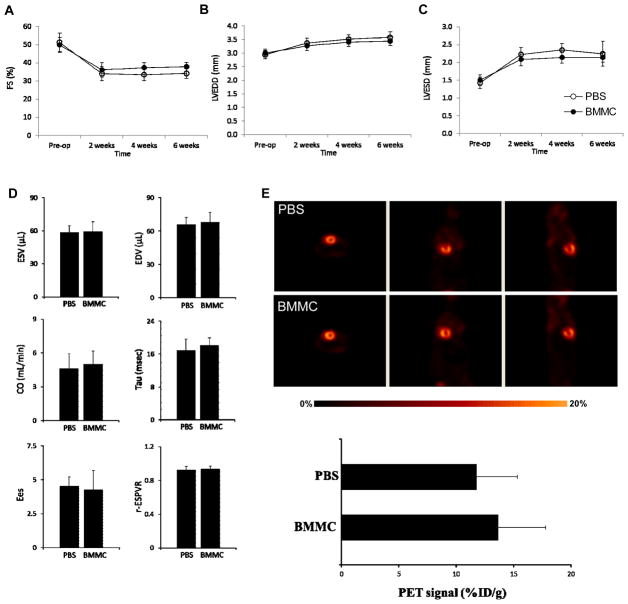
Methods and results: We used bioluminescence imaging and high-throughput transcriptional profiling to evaluate the in vivo survival kinetics and gene expression changes of transplanted BMMCs after their engraftment into ischemic myocardium. Our results demonstrate short-lived survival of cells following transplant, with less than 1% of cells surviving by 6 weeks posttransplantation. Moreover, transcriptomic analysis of BMMCs revealed nonspecific upregulation of various cell regulatory genes, with a marked downregulation of cell differentiation and maturation pathways. BMMC therapy caused limited improvement of heart function as assessed by echocardiography, invasive hemodynamics, and positron emission tomography. Histological evaluation of cell fate further confirmed findings of the in vivo cell tracking and transcriptomic analysis.

Conclusions: Collectively, these data suggest that BMMC therapy, in its present iteration, may be less efficacious than once thought. Additional refinement of existing cell delivery protocols should be considered to induce better therapeutic efficacy.


Figures

Figure 1
Figure 1. Characterization of L2G bone marrow
Analysis of lineage negative (Lin) fraction of bone marrow (A) reveals 0.058% of L2G marrow cells are of the “classical” hematopoietic stem cell (HSC) phenotype (B, Lin, c-kit+, Sca-1+). L2G HSCs express GFP at high levels (C). Analysis of marrow (D) demonstrates significant fractions of CD8+ and CD4+ cells (E), as well as granulocyte lineage (Gr-1+) and B-cell lineage (B220) expressing cells (F). The fraction of mesenchymal stem cells (CD11b, CD45, Sca-1+, CD44+) is 0.025%, comparable to wild type (G–I).
Figure 2
Figure 2. Comparison of L2G marrow versus wild type and in vitro analysis of reporter gene expression
Lineage negative populations from L2G (A) and age/sex-matched wild type mice (B) demonstrate similar frequencies of hematopoietic stem cell (Lin, c-kit+, Sca-1+) fractions. Thy 1.1 (C) and Flk-2 (D) analysis of HSCs from L2G mice demonstrate similar profiles to those reported for wild type. (E) GFP signal from HSC from wild type (black line) and L2G (green line) demonstrates strong GFP expression by transgenic mice. (F) Confocal microscopy reveals robust GFP expression by bone marrow mononuclear cells (BMMC) from L2G mice (scale bar = 5 μm). In vitro analysis of Fluc reporter gene expression by L2G85 BMMCs demonstrates robust correlation between bioluminescent imaging and cell number (G) as quantified further by linear regression analysis of imaging signal versus cell number (H, R2=0.99) and Fluc enzyme activity versus cell number (I, R2=0.98).
Figure 3
Figure 3. Longitudinal bioluminescent imaging analysis of BMMC transplantation into normal and ischemic hearts reveals differential early survival patterns
(A) Images following the same two animals (sham on left and ischemia-reperfusion [I/R] on the right) demonstrate significantly lower number of cells on day 2 in ischemic hearts. Ischemia also induced a proliferation response resulting in a rapid rise in BLI signal between days 2 and 4 in the I/R group (scales represent BLI signal in p/s/cm2/sr). Longitudinal cell survival was similar in both groups, reaching background levels by day 42. Average BLI signal from both sham (n=8) and I/R (n=8) groups are summarized in (B). Background signal range is given by the area shaded blue. Error bars represent SEM, *P < 0.05.
Figure 4
Figure 4. Validation of in vivo imaging by real time-PCR analysis of SRY containing L2G BMMCs transplanted into female recipient hearts
(A) Ex vivo correlation between PCR cycle number (probing for SRY) for known number of male cells transplanted into female hearts demonstrates an R2 value of 0.99. (B) Regression analysis of BLI signal generated from hearts imaged in vivo (n=8) at different times following BMMC transplantation followed by real time PCR analysis for SRY demonstrates a robust correlation between BLI signal and SRY copy number (r2=0.95). Right axis gives expected cell number for given BLI signal based on ex vivo analysis depicted in (A).
Figure 5
Figure 5. Genomic profiling of BMMCs transplanted into ischemic myocardium reveals down-regulation of differentiation and cell fate commitment pathways
Ball-and-stick figures represent ontological cluster function analysis of gene expression changes. Enumerated spheres represent significantly up- or down-regulated groups of genes (GO-terms). Size of spheres correlates to the significance of enrichment of the GO term (sphere radius is proportional to −log10[p-value for GO-term]) and numbers within sphere designate number of genes within the GO-term significantly up or down-regulated. Solid lines represent parent-daughter relationship between terms; terms related otherwise are connected by dashed lines. Functional groups were further sub-sorted into Molecular Function (A) and Biological Processes (B).
Figure 6
Figure 6. Histological evaluation of transplanted BMMCs confirms microarray analysis with no evidence of transdifferentiation
(A) Masson-Trichome staining of heart 7 days following I/R injury demonstrates infarct zone emanating from area supplied by left anterior coronary artery (scale bar = 100 μm). (B) Low power view of heart 7 days following I/R injury followed by BMMC injection. Native myocardium is stained with troponin (red) and transplanted cells can be seen expressing the GFP reporter gene (green, scale bar = 100 um). (C) High power view of cells within infarct zone co-stained with DAPI (blue) demonstrate intra-cytosolic GFP expression (scale bar = 20 um). Staining for cardiac markers troponin (D) and connexin43 (E) reveal no expression by transplanted cells (scale bars = 30 μm).
Figure 7
Figure 7. Functional analysis reveals no long-term improvement following BMMC therapy
Echocardiography demonstrates trend towards improved ejection fraction (A) in hearts receiving BMMC versus PBS. Assessment of (B) end-systolic and(C) end-diastolic diameters suggests mild improvement of systolic and diastolic function, respectively. However, these trends did not achieve statistical significance. (D) Invasive hemodynamic analysis confirms echocardiography revealing no significant difference between various functional measures (ESV; end-systolic volume, EDV; end-diastolic volume, CO; cardiac output, Tau; ventricular relaxation time constant, Ees; end-systolic elastance, r-ESPVR; correlation coefficient of the end-systolic pressure volume relationship) as assessed for hearts receiving BMMC versus PBS. (E) PET [18F]-FDG imaging of hearts receiving PBS (top) versus BMMC (bottom row) demonstrates no significant improvement of myocardial viability following BMMC therapy. PET imaging signals are quantified as a histogram below the images.

Comment in

References

    1. Schachinger V, Assmus B, Britten MB, Honold J, Lehmann R, Teupe C, Abolmaali ND, Vogl TJ, Hofmann WK, Martin H, Dimmeler S, Zeiher AM. Transplantation of progenitor cells and regeneration enhancement in acute myocardial infarction: Final one-year results of the topcare-ami trial. J Am Coll Cardiol. 2004;44:1690–1699. - PubMed
    1. Schachinger V, Erbs S, Elsasser A, Haberbosch W, Hambrecht R, Holschermann H, Yu J, Corti R, Mathey DG, Hamm CW, Suselbeck T, Assmus B, Tonn T, Dimmeler S, Zeiher AM. Intracoronary bone marrow-derived progenitor cells in acute myocardial infarction. N Engl J Med. 2006;355:1210–1221. - PubMed
    1. Lunde K, Solheim S, Aakhus S, Arnesen H, Abdelnoor M, Egeland T, Endresen K, Ilebekk A, Mangschau A, Fjeld JG, Smith HJ, Taraldsrud E, Grogaard HK, Bjornerheim R, Brekke M, Muller C, Hopp E, Ragnarsson A, Brinchmann JE, Forfang K. Intracoronary injection of mononuclear bone marrow cells in acute myocardial infarction. N Engl J Med. 2006;355:1199–1209. - PubMed
    1. Wollert KC, Meyer GP, Lotz J, Ringes-Lichtenberg S, Lippolt P, Breidenbach C, Fichtner S, Korte T, Hornig B, Messinger D, Arseniev L, Hertenstein B, Ganser A, Drexler H. Intracoronary autologous bone-marrow cell transfer after myocardial infarction: The boost randomised controlled clinical trial. Lancet. 2004;364:141–148. - PubMed
    1. Meluzin J, Janousek S, Mayer J, Groch L, Hornacek I, Hlinomaz O, Kala P, Panovsky R, Prasek J, Kaminek M, Stanicek J, Klabusay M, Koristek Z, Navratil M, Dusek L, Vinklarkova J. Three-, 6-, and 12-month results of autologous transplantation of mononuclear bone marrow cells in patients with acute myocardial infarction. Int J Cardiol. 2008;128:185–192. - PubMed

Publication types