Comparative Study
. 2011 Dec;157(4):1596-608.
doi: 10.1104/pp.111.183921. Epub 2011 Oct 27.

A 3,000-loci transcription map of chromosome 3B unravels the structural and functional features of gene islands in hexaploid wheat

Affiliations
Comparative Study

A 3,000-loci transcription map of chromosome 3B unravels the structural and functional features of gene islands in hexaploid wheat

Camille Rustenholz et al. Plant Physiol. 2011 Dec.

Abstract

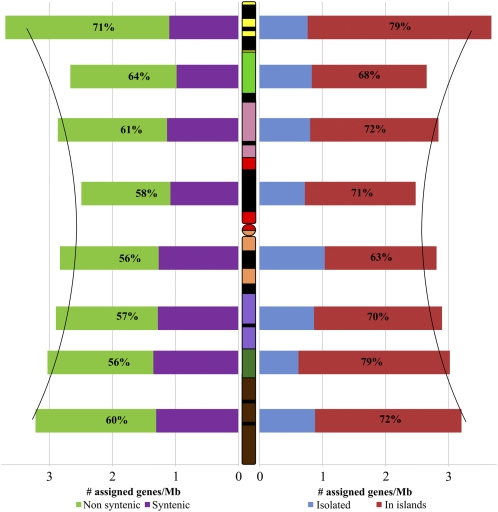
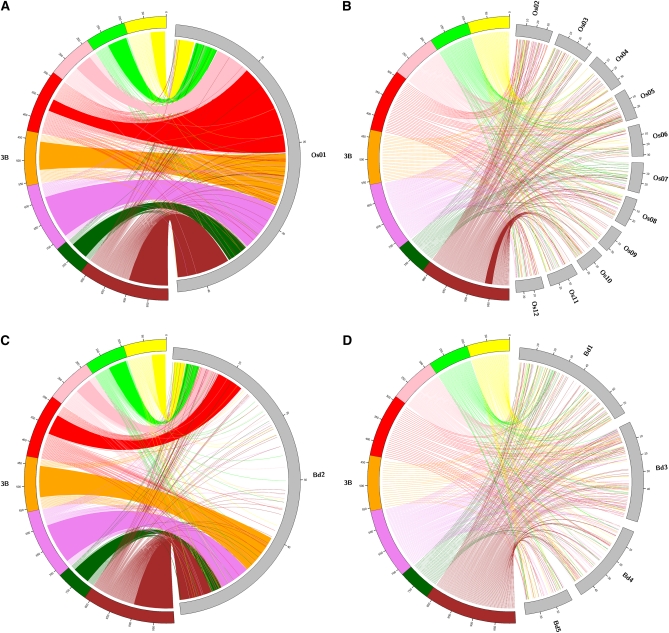
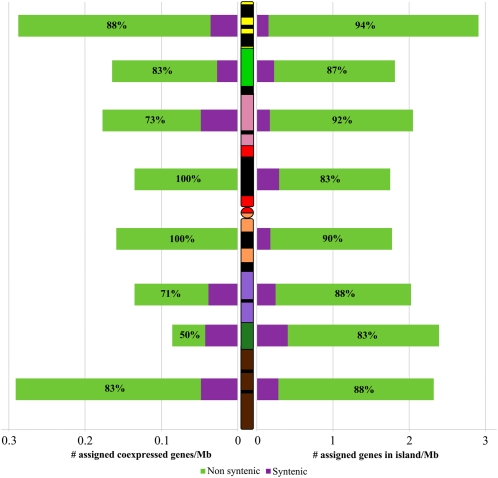
To improve our understanding of the organization and regulation of the wheat (Triticum aestivum) gene space, we established a transcription map of a wheat chromosome (3B) by hybridizing a newly developed wheat expression microarray with bacterial artificial chromosome pools from a new version of the 3B physical map as well as with cDNA probes derived from 15 RNA samples. Mapping data for almost 3,000 genes showed that the gene space spans the whole chromosome 3B with a 2-fold increase of gene density toward the telomeres due to an increase in the number of genes in islands. Comparative analyses with rice (Oryza sativa) and Brachypodium distachyon revealed that these gene islands are composed mainly of genes likely originating from interchromosomal gene duplications. Gene Ontology and expression profile analyses for the 3,000 genes located along the chromosome revealed that the gene islands are enriched significantly in genes sharing the same function or expression profile, thereby suggesting that genes in islands acquired shared regulation during evolution. Only a small fraction of these clusters of cofunctional and coexpressed genes was conserved with rice and B. distachyon, indicating a recent origin. Finally, genes with the same expression profiles in remote islands (coregulation islands) were identified suggesting long-distance regulation of gene expression along the chromosomes in wheat.


Figures

Figure 1.
Figure 1.
Gene distribution along the wheat chromosome 3B. Each color on wheat chromosome 3B corresponds to a deletion bin. Yellow, 3BS8-0.78-1.00; light green, 3BS9-0.57-0.78; pink, 3BS1-0.33-0.57; red, C-3BS1-0.33; orange, C-3BL2-0.22; purple, 3BL2-0.22-0.50; dark green, 3BL10-0.50-0.63; and brown: 3BL7-0.63-1.00. The black segments correspond to heterochromatic regions identified by C-banding, the colored segments to the euchromatic regions, and the circle to centromere. On the left, the density of syntenic genes is represented by purple bars. The density of nonsyntenic genes is represented by green bars. The proportions of nonsyntenic genes per deletion bins are shown as percentages within the green bars. On the right, the density of isolated genes is represented by blue bars. The density of genes organized in island is represented by red bars. The proportions of genes organized in island per deletion bin are shown as percentages within the red bars. The two black curves represent the regression curve of gene density.
Figure 2.
Figure 2.
Syntenic relationships between wheat chromosome 3B and rice and B. distachyon chromosomes. A, Syntenic genes between wheat chromosome 3B (3B) and rice orthologous chromosome 1 (Os01). The axes along the chromosomes indicate the physical position in Mb. The eight deletion bins of wheat chromosome 3B are represented in colors as in Figure 1. Each line starting in a wheat deletion bin and ending on rice chromosome 1 represents a gene assigned to the deletion bin for which an orthologous gene on rice chromosome 1 was identified. The color of the line corresponds to the color of the deletion bin to which the gene was assigned. The colored blocks represent blocks of microsynteny, i.e. blocks of genes which location on wheat chromosome 3B and rice chromosome 1 is conserved. The genes within each deletion bin were ordered according to the order of their orthologs on rice chromosome 1. B, Nonsyntenic genes between wheat chromosome 3B (3B) and the other rice chromosomes. A block of genes between 3BL7 deletion bin and rice chromosome 10 was drawn as these genes are conserved with the same order than their orthologs on rice chromosome 10. C, Syntenic genes between wheat chromosome 3B (3B) and B. distachyon orthologous chromosome 2 (Bd2). D, Nonsyntenic genes between wheat chromosome 3B (3B) and the other B. distachyon chromosomes.
Figure 3.
Figure 3.
Proportion of syntenic and nonsyntenic gene islands and coexpression clusters along the wheat chromosome 3B. The purple bars represent the density of genes part of an island or a coexpression cluster composed by syntenic genes only. The green bars represent the density of genes part of an island or a coexpression cluster in which at least one nonsyntenic gene is present. On the left, the density of genes part of a coexpression cluster is shown. The proportions of genes part of coexpression cluster in which at least one nonsyntenic gene is present are shown as percentages within the green bars. On the right, the density of genes in island is shown. The proportions of genes in island in which at least one nonsyntenic gene is present are shown as percentages within the green bars.
Figure 4.
Figure 4.
Correlation maps of gene expression profiles. The correlations of gene expression profiles are represented using the green-magenta scale shown. Light green corresponds to positive correlation and light magenta to negative correlation. A, Correlation map of chromosome 3B. The chromosome 3B is schematically depicted as in Figure 1. The contigs were ordered as described in “Materials and Methods.” The green clusters on the diagonal line correspond to coexpression clusters. B, Zoom of the orange squared region in A. Some coexpression clusters are circled in yellow. A coregulation island composed of two coexpression clusters with correlated expression profiles distantly is circled in white.

Similar articles

Cited by

References

    1. Akhunov ED, Goodyear AW, Geng S, Qi LL, Echalier B, Gill BS, Miftahudin , Gustafson JP, Lazo G, Chao S, et al. (2003) The organization and rate of evolution of wheat genomes are correlated with recombination rates along chromosome arms. Genome Res 13: 753–763 - PMC - PubMed
    1. Altschul SF, Madden TL, Schäffer AA, Zhang JH, Zhang Z, Miller W, Lipman DJ. (1997) Gapped BLAST and PSI-BLAST: a new generation of protein database search programs. Nucleic Acids Res 25: 3389–3402 - PMC - PubMed
    1. Arabidopsis Genome Initiative (2000) Analysis of the genome sequence of the flowering plant Arabidopsis thaliana. Nature 408: 796–815 - PubMed
    1. Babu MM, Janga SC, de Santiago I, Pombo A. (2008) Eukaryotic gene regulation in three dimensions and its impact on genome evolution. Curr Opin Genet Dev 18: 571–582 - PubMed
    1. Batada NN, Urrutia AO, Hurst LD. (2007) Chromatin remodelling is a major source of coexpression of linked genes in yeast. Trends Genet 23: 480–484 - PubMed

Publication types

MeSH terms

LinkOut - more resources