. 2011 Nov 11;147(4):840-52.
doi: 10.1016/j.cell.2011.09.045. Epub 2011 Oct 27.

A conserved SREBP-1/phosphatidylcholine feedback circuit regulates lipogenesis in metazoans

Affiliations

A conserved SREBP-1/phosphatidylcholine feedback circuit regulates lipogenesis in metazoans

Amy K Walker et al. Cell. .

Abstract

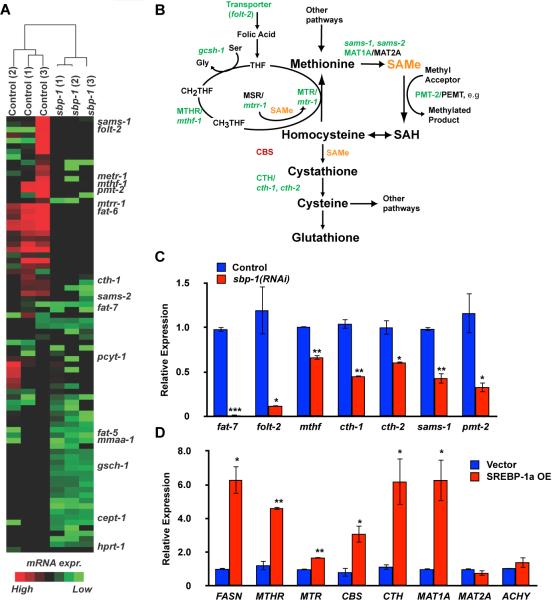
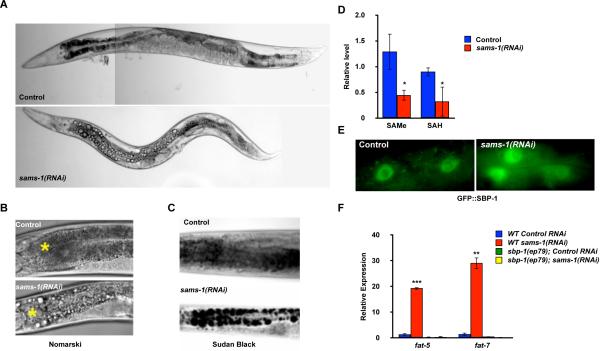
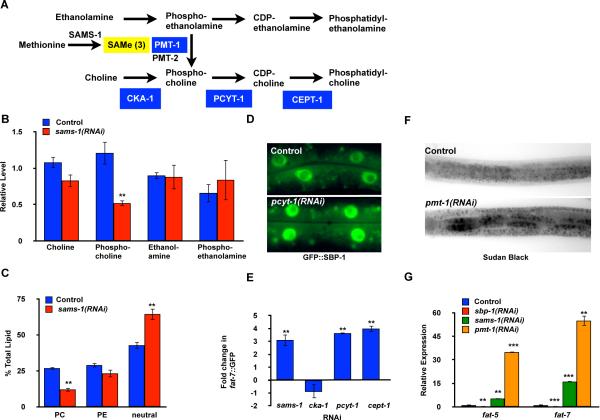
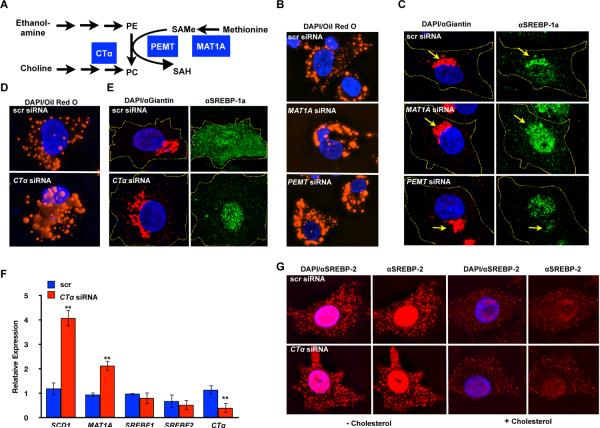
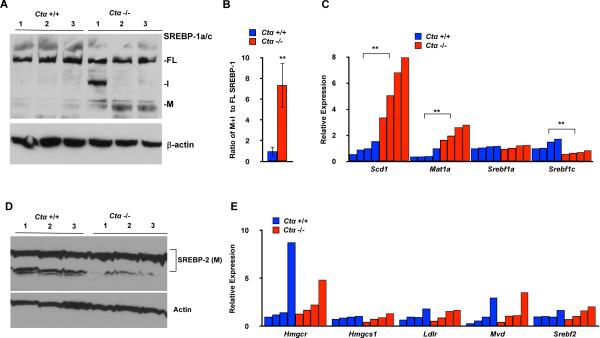
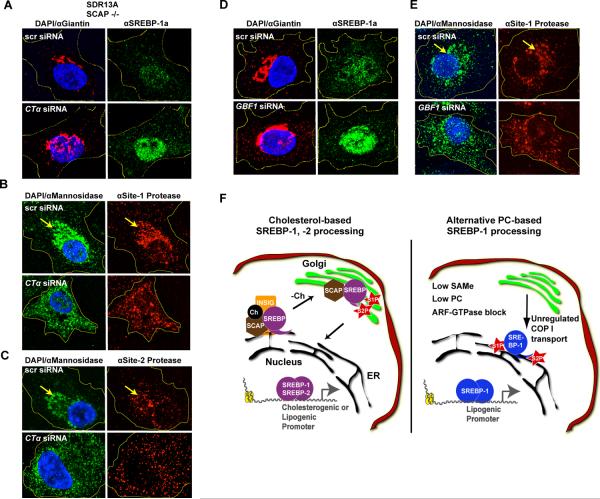
Sterol regulatory element-binding proteins (SREBPs) activate genes involved in the synthesis and trafficking of cholesterol and other lipids and are critical for maintaining lipid homeostasis. Aberrant SREBP activity, however, can contribute to obesity, fatty liver disease, and insulin resistance, hallmarks of metabolic syndrome. Our studies identify a conserved regulatory circuit in which SREBP-1 controls genes in the one-carbon cycle, which produces the methyl donor S-adenosylmethionine (SAMe). Methylation is critical for the synthesis of phosphatidylcholine (PC), a major membrane component, and we find that blocking SAMe or PC synthesis in C. elegans, mouse liver, and human cells causes elevated SREBP-1-dependent transcription and lipid droplet accumulation. Distinct from negative regulation of SREBP-2 by cholesterol, our data suggest a feedback mechanism whereby maturation of nuclear, transcriptionally active SREBP-1 is controlled by levels of PC. Thus, nutritional or genetic conditions limiting SAMe or PC production may activate SREBP-1, contributing to human metabolic disorders.


Figures

Figure 1
Figure 1. Co-regulation one-carbon cycle and fatty acid biosynthesis genes by SBP-1/SREBP-1
A. Unbiased hierarchical clustering of genes more than two-fold downregulated in sbp-1(RNAi) nematodes and with metabolic regulation KEGG terms shows that one-carbon cycle (1CC) genes are decreased similarly to known SBP-1-responsive genes in lipid metabolism. B. Schematic diagram of the one-carbon cycle (1CC). SBP-1-dependent genes in C. elegans are shown in green; genes responsive to mammalian SREBP-1 are shown in red. C. Quantitative RT-PCR (qRT-PCR) from control or sbp-1(RNAi) nematodes reveals that multiple 1CC genes require SBP-1 for expression. D. qRT-PCR from 293T cells overexpressing SREBP-1a shows that expression of multiple 1CC genes increases with elevated SREBP-1 activity. Error bars show standard deviation. Statistical relevance (p value) shown by <0.05, *; <0.01, **; <0.005, ***.
Figure 2
Figure 2. In C. elegans, SBP-1-dependent lipogenesis and gene expression are increased after sams-1(RNAi)
A. RNAi knockdown of sams-1 revealed large refractile droplets in the intestine and body cavity by Nomarski optics. B. Enlarged view of droplets by Nomarski optics. The first sets of intestinal cells are shown, the position of the pharynx is marked with a yellow star. C. Staining with Sudan Black shows that droplets in sams-1(RNAi) nematodes contain lipids. D. SAMe and SAH levels are significantly decreased after sams-1(RNAi). Error bars represent standard error between triplicate independent experiments. E. Nuclear accumulation of a GFP∷SBP-1 fusion protein is increased in sams-1(RNAi) intestinal cells. F. qRT-PCR comparing levels of fat-5 and fat-7 in wild-type or a hypomorphic sbp-1 allele (ep79) demonstrated that FA desaturase upregulation in sams-1(RNAi) animals depends on sbp-1. Statistical relevance (p value) shown by <0.05, *; <0.01, **, <0.005, ***.
Figure 3
Figure 3. Increased lipogenesis and SBP-1-dependent gene expression after sams-1 RNAi in C. elegans is linked to limited phosphatidylcholine (PC) production
A. Schematic diagram of links between methyl production and phospholipid biosynthesis in nematodes. Enzymes whose functions are disrupted by RNAi in subsequent panels are shown in blue boxes. B. Analysis of metabolites in sams-1(RNAi) nematodes shows that PC precursors downstream of methylation steps are decreased (phosphocholine), whereas metabolites upstream (choline, ethanolamine, phosphoethanolamine) are unchanged or slightly increased. Error bars represent standard error between quadruplicate independent experiments. C. Quantitative analysis show that PC levels are diminished after sams-1(RNAi). Error bars represent standard error between quadruplicate independent experiments. D. GFP∷SBP-1 accumulates in intestinal nuclei after pcyt-1(RNAi). E. Quantitative measurement of pfat-7∷GFP intensity in C. elegans populations by a COPAS biosorter shows that RNAi knockdown of PC biosynthesis genes downstream of methylation steps activate this SBP-1-dependent reporter at similar levels to sams-1 RNAi. Blocking methylation-dependent PC production by interference with PMT-1 produces similar phenotypes to sams-1(RNAi), such as increased lipid droplet formation (F) and overexpression of SBP-1 transcriptional targets, fat-5 and fat-7 (G). Error bars show standard deviation, statistical relevance (p value) shown by <0.05, *; <0.01, **, <0.005, ***.
Figure 4
Figure 4. Increase in lipid droplet formation and SREBP-1a nuclear localization in human hepatoma cells in response to SAMe/PC depletion
A. Schematic diagram of links between mammalian methyl production and phospholipid biosynthesis. Enzymes whose functions are disrupted by siRNA in subsequent panels are shown in blue boxes. siRNA knockdown of PEMT, MAT1A (B) or CTα (D) causes increased accumulation of large lipid droplets by Oil Red O staining in HepG2 cells in lipid-depleted serum. Immunostaining with an antibody against SREBP-1a shows increased nuclear accumulation after PEMT, MAT1A (C) or CTα (E) knockdown. Cells were co-stained with antibodies recognizing the Golgi marker Giantin. Yellow lines show outline of cells. F. Analysis of gene expression in CTα knockdown HepG2 cells by qRTPCR shows increases in SREBP-1-dependent genes such as SCD1 and MAT1A. G. Antibodies directed against SREBP-2 were used to stain HepG2 cells in lipid-depleted serum in the presence or absence of 10 μg/ml cholesterol in control or CTα siRNA-treated cells.
Figure 5
Figure 5. Increase in SREBP-1 processing and target gene expression in Ctα knockout mouse livers
A. Immunoblotting of extracts from mice with a liver-specific knockout of Ctα (Jacobs et al., 2004) limiting the CDP-choline pathway shows increased SREBP-1a/c processing (Jacobs et al., 2004). Fl is full-length SREBP-1a/c precursor; I, intermediate form; M, mature, transcriptionally active form. B. Analysis of the immunoblot by densitometry shows increases in proteolytic products of SREBP-1 in livers from Ctα knockout mice. C. Analysis of gene expression by qRT-PCR from Ctα knockout mice show increased expression of Scd1, an SREBP-1 target, as well as Mat1a, ortholog of sams-1. Bars represent individual mice, error bars show standard deviation; statistical relevance (p value<0.01) shown by (**). Analysis of gene expression by qRT-PCR from the liver-specific Ctα knockout mice (Jacobs et al., 2004) show no statistically significant changes in levels of mature, processed SREBP-2 (D) or target gene expression (E). Bars represent individual mice, error bars show standard deviation; statistical relevance (p value<0.01) shown by (**).
Figure 6
Figure 6. Relocalization of SREBP-activating proteases in mammalian cells when PC production is blocked
A. SREBP-1 accumulates in the nucleus after CTα siRNA treatment in SRD13A cells, which lack a functional SCAP. Yellow lines show cell outlines. Co-immunostaining of HepG2 cells with the Golgi marker α-mannosidase and antibodies to S1P (B) or S2P (C) shows a strong shift away from an organized Golgi structure and disorganization of SREBP-activating protease staining after CTα knockdown. Yellow arrow marks Golgi body in control cells. Interference with ARF-GTPase signaling by GBF1 siRNA treatment of HepG2 cells increases SREBP-1 nuclear accumulation (D) and disrupts Golgi-specific partitioning of S1P (E.) F. Schematic model for relocalization of SREBP-activating proteases, resulting in activation of SREBP-1 and transit to the nucleus upon decreases in SAMe or PC levels or blocks in ARF-GTPase cycles.

Comment in

  • New driver for lipid synthesis.
    Houten SM, Argmann CA. Houten SM, et al. Cell. 2011 Nov 11;147(4):719-21. doi: 10.1016/j.cell.2011.10.019. Cell. 2011. PMID: 22078872

References

    1. Ashrafi K, Chang FY, Watts JL, Fraser AG, Kamath RS, Ahringer J, Ruvkun G. Genome-wide RNAi analysis of Caenorhabditis elegans fat regulatory genes. Nature. 2003;421:268–272. - PubMed
    1. Bartz R, Sun LP, Bisel B, Wei JH, Seemann J. Spatial separation of Golgi and ER during mitosis protects SREBP from unregulated activation. EMBO J. 2008;27:948–955. - PMC - PubMed
    1. Bigay J, Gounon P, Robineau S, Antonny B. Lipid packing sensed by ArfGAP1 couples COPI coat disassembly to membrane bilayer curvature. Nature. 2003;426:563–566. - PubMed
    1. Brendza KM, Haakenson W, Cahoon RE, Hicks LM, Palavalli LH, Chiapelli BJ, McLaird M, McCarter JP, Williams DJ, Hresko MC, et al. Phosphoethanolamine N-methyltransferase (PMT-1) catalyses the first reaction of a new pathway for phosphocholine biosynthesis in Caenorhabditis elegans. Biochemical Journal. 2007;404:439–448. - PMC - PubMed
    1. Brown MS, Goldstein JL. The SREBP pathway: regulation of cholesterol metabolism by proteolysis of a membrane-bound transcription factor. Cell. 1997;89:331–340. - PubMed

Publication types

Substances