. 2011 Oct 28;147(3):603-14.
doi: 10.1016/j.cell.2011.08.048.

Altered modes of stem cell division drive adaptive intestinal growth

Affiliations

Altered modes of stem cell division drive adaptive intestinal growth

Lucy Erin O'Brien et al. Cell. .

Abstract

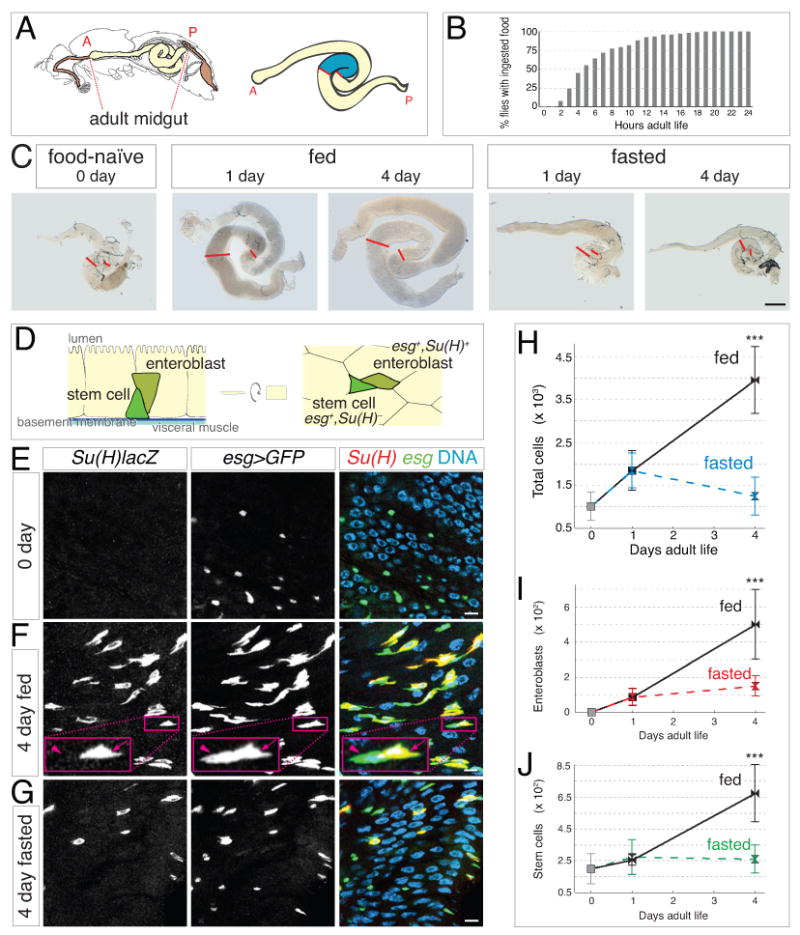
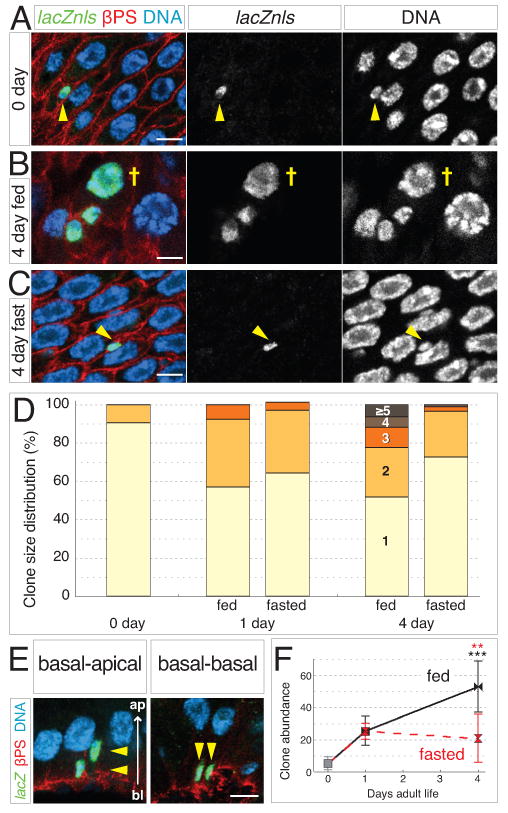
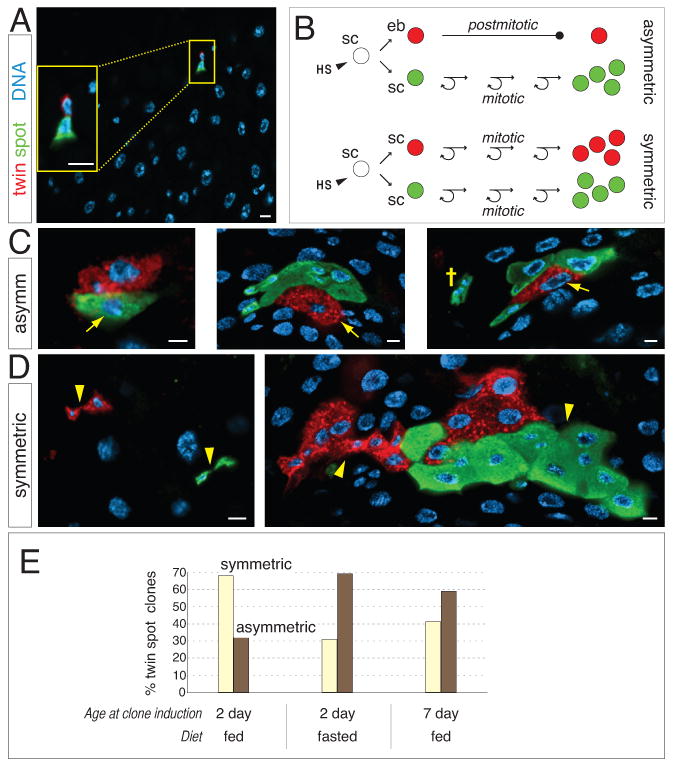
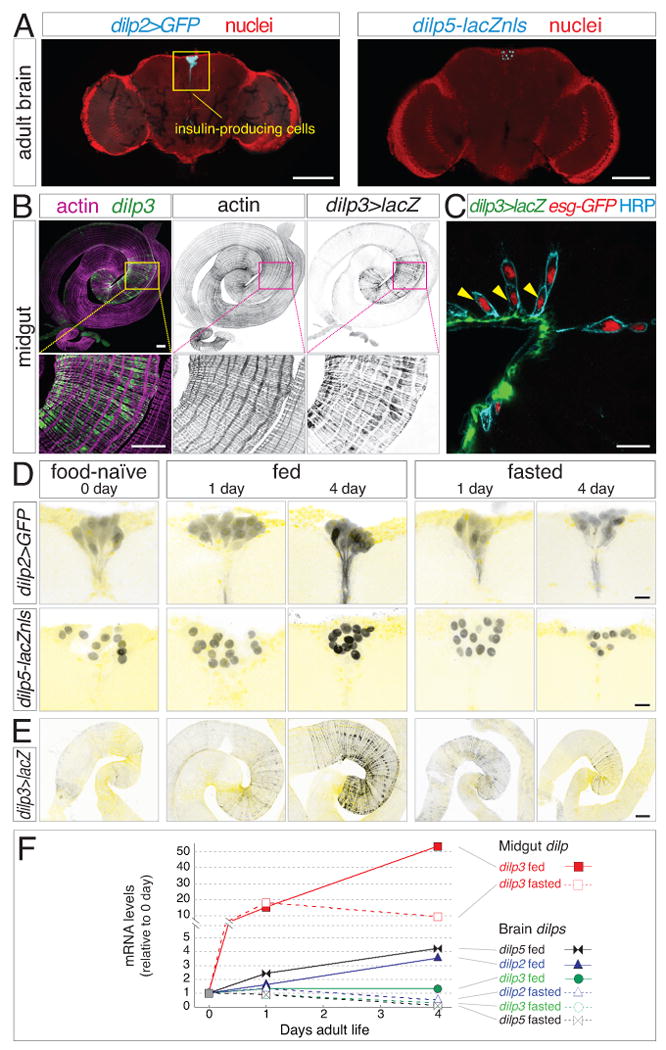
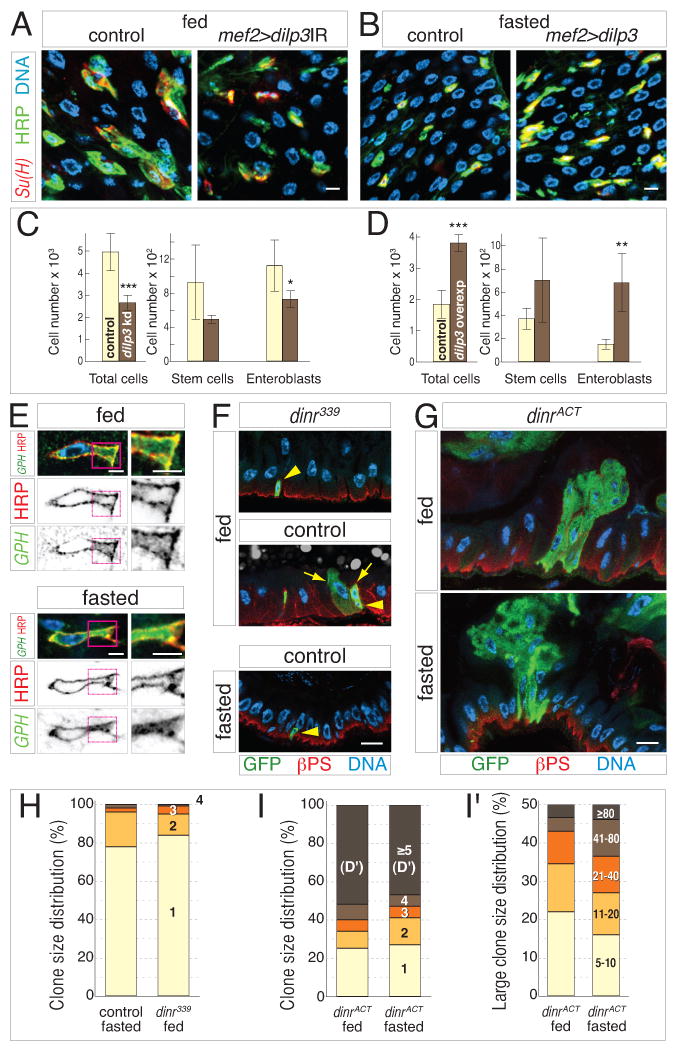
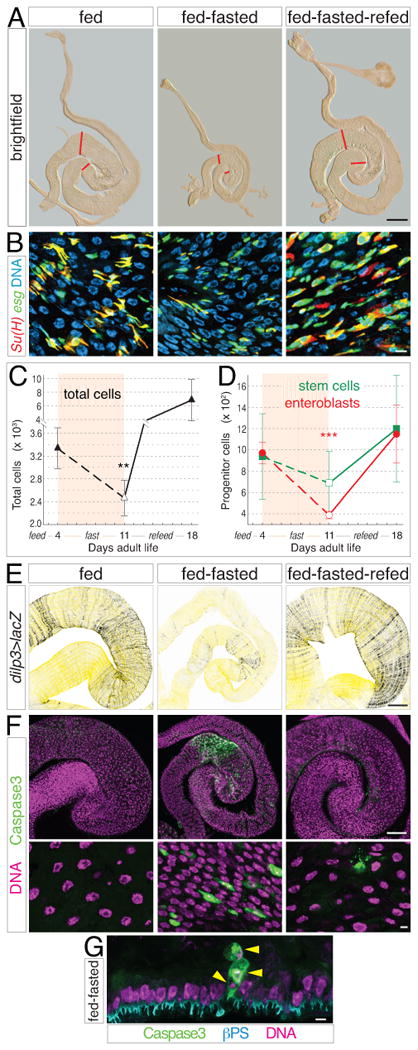
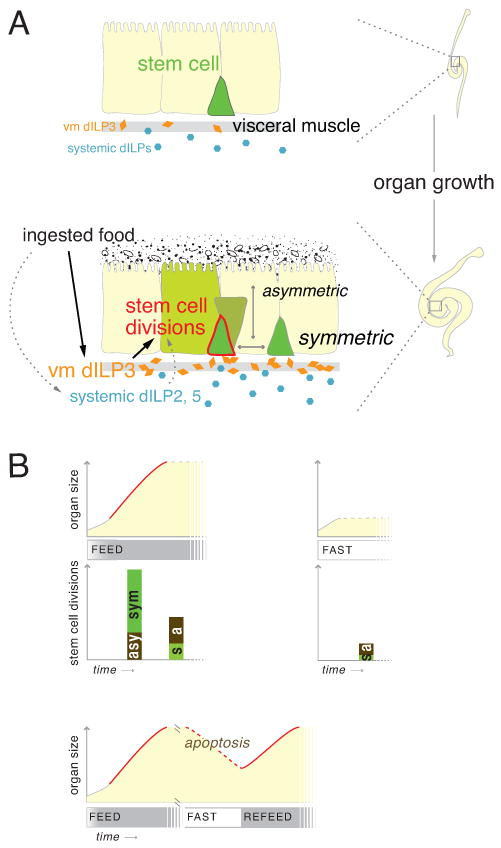
Throughout life, adult organs continually adapt to variable environmental factors. Adaptive mechanisms must fundamentally differ from homeostatic maintenance, but little is known about how physiological factors elicit tissue remodeling. Here, we show that specialized stem cell responses underlie the adaptive resizing of a mature organ. In the adult Drosophila midgut, intestinal stem cells interpret a nutrient cue to "break homeostasis" and drive growth when food is abundant. Activated in part by niche production of insulin, stem cells direct a growth program through two altered modes of behavior: accelerated division rates and predominance of symmetric division fates. Together, these altered modes produce a net increase in total intestinal cells, which is reversed upon withdrawal of food. Thus, tissue renewal programs are not committed to maintain cellular equilibrium; stem cells can remodel organs in response to physiological triggers.


Figures

Figure 1
Figure 1. Food intake stimulates concomitant expansion of total and progenitor cell populations in new adult midguts
(A) Left, sagittal view of adult fly gastrointestinal tract (modified from (Miller, 1950)). Right, expanded view of midgut with the distal hairpin region in blue. Anterior (A) and posterior (P) ends of the midgut are indicated. (B) Commencement of adult food intake. Mean age at first meal is 6.4 ±3.9 hours (S.E.M.), and median age is 5 hours. n = 113. (C) Gross midgut size increases in fed but not fasted animals during the first 4 days of adult life. Red lines show boundaries of distal hairpin region. Scale bar, 0.5 mm. (D) Anatomy and markers of midgut progenitors. Stem cells (esg+, Su(H)lacZ) are at the basal surface of the intestinal epithelium, adjacent to basement membrane and visceral muscle layers. Enteroblasts (esg+, Su(H)lacZ+) localize apically to their mother stem cell. Characteristic appearance of mother stem cell-daughter enteroblast pairs is shown in cross section (left) and grazing section (right). (E-G) Feeding increases the abundance of enteroblasts and stem cells. Su(H)lacZ, esg>GFP midguts were stained for β-galactosidase (red), GFP (green), and DNA (blue). (E) 0-day guts. Enteroblasts (yellow in merge) are nearly absent, suggesting that stem cells (green in merge) are inactive. (F) After 4 days of feeding, enteroblasts (arrow) and stem cells (arrowhead) are more abundant. (G) In 4-day fasted guts, enteroblasts are less abundant and stem cells are sparse. All scale bars, 5 μm. (H-J) Comprehensive censuses of the distal hairpin. (H) ∼300% increase in total cells between 0-day guts and 4-day fed guts but not 4-day fasted guts. (I) Enteroblasts are nearly absent in 0-day guts, increase substantially in 4-day fed guts, and increase to a far lesser extent in 1-day fed and fasted guts and 4-day fasted guts. (J) ∼240% increase in stem cells between 0-day guts and 4-day fed guts but not 4-day fasted guts. Data are means ± S.D; p<0.00005. See also Supplemental Figure S1 and Supplemental Table S1.
Figure 2
Figure 2. Feeding increases the size and abundance of individual stem cell clones
(A-C) Stem cell clones grow larger in fed guts. Clones labeled with tub-lacZnls in green; DNA is blue and βPS integrin outlines cells in red. (A) At 0 days, most labeled cells are single, stem-like cells (arrowhead). (B) In 4-day fed guts, multicell clones are numerous and include polyploid enterocytes (cross). (C) In 4-day fasted guts, most labeled cells remain as single stem-like cells (arrowhead). Scale bars, 5 μm. (D) Feeding promotes clone growth. At 0 day, nearly all clones contain one cell. In 1-day fed and fasted guts, the proportion of 2-cell clones increases. In 4-day fed guts, clones containing 3 or more cells have become more prevalent. In 4-day fasted guts, 1-cell clones remain predominant. See also Supplemental Table S2. (E) In cross sections of the gut epithelium, 2-cell clones exhibit either basal-apical (left) or basal-basal arrangements (right). Scale bar, 5 μm. (F) Feeding increases clone abundance. Between 0 and 1 day, clone abundance (number of discrete clones per distal hairpin) rises 5-fold in fed and fasted guts. In 4-day fed guts, clone abundance has increased to 10-fold higher than at 0 day. In 4-day fasted guts, no further increase occurs. Data are means ± S.D. and obtained from same guts as (D). Black asterisks, p=0.0004 (0 day and 4 day fed); red asterisks, p=0.0026 (4 day fasted and 4 day fed). See also Supplemental Table S2.
Figure 3
Figure 3. Symmetric stem cell divisions predominate during organ growth
(A) Following clone induction with twin-spot MARCM, the two daughters of a stem cell division are differentially labeled with GFP and RFP (inset). Scale bars, 5 μm. (B) Schematic cartoon of twin spot fate signatures. HS, heat shock; sc, stem cell; eb, enteroblast. (C) In asymmetric twin spots, first-born daughter enteroblasts have differentiated into polyploid enterocytes (arrows) and are uniquely labeled. Stem cell daughters have generated additional progeny bearing the alternate label. (Far right) A mono-labeled, 3-cell cluster (cross) near the asymmetric twin spot suggests that a later symmetric division followed the initial asymmetric division. Scale bars, 5 μm. (D) In symmetric twin spots, both daughters generate additional cells. Sister lineages (arrowheads) can be either separated, implying that stem cells did not remain juxtaposed (left), or contiguous (right). Scale bars, 5 μm. (E) Quantitation of division modes in fed and fasted guts. Twin spots were induced at the indicated times, and asymmetric and symmetric signatures were scored 4 days later. See also Supplemental Table S4.
Figure 4
Figure 4. Local insulin production by midgut muscle fibers surpasses systemic insulin upregulation
(A) Expression of dilp2>GFP and dilp5-lacZnls (cyan) by insulin-producing neurons in the adult brain. Nuclei, red. Scale bars, 100 μm. (B) Expression of dilp3 in visceral muscle of the midgut distal hairpin. dilp3>lacZ (green, β-galactosidase) colocalizes with actin-rich circular muscle fibers (magenta). Scale bars: 250 μm top, 100 μm bottom. (C) In cross section, dilp3-expressing muscle fibers (dilp3>lacZ, green) juxtapose stem cells (arrowheads). Basal stem cells and apical enteroblasts are both marked by nuclear esg-GFP (red) and peripheral anti-HRP (cyan). Scale bar, 15 μm. (D) Brain dilp2 and dilp5 reporters are elevated only after 4 days of feeding. Nuclei in pale yellow. Scale bars, 10 μm. (E) Midgut dilp3>lacZ increases after 1 day irrespective of diet and continues to rise with 4 days of feeding but not fasting. Actin in pale yellow. Scale bars, 100 μm. (F) Local dilp upregulation surpasses systemic upregulation. Kinetics of dilp mRNA levels in wild type midguts and brains (derived from same animals) as assessed by qPCR. Midgut dilp3 transcripts increase rapidly with 1 day of feeding (closed red squares) or fasting (open red squares), and continue to rise dramatically with 4 days of feeding but not fasting. Compared to gut dilp3, brain dilps increase either mildly (dilp2, triangles; dilp5, bowtie) or not at all (dilp3, circles) with feeding; all three decrease below baseline with fasting. One of three representative experiments is shown.
Figure 5
Figure 5. Midgut insulin acts directly on stem cells to induce intestinal growth
(A-B) Midgut dILP3 controls progenitor cell abundance downstream of feeding. Knockdown (Su(H)lacZ; mef2ts>dilp3IR), overexpression (Su(H)lacZ; mef2ts>dilp3), and control (Su(H)lacZ; mef2ts) midguts were stained for β-galactosidase (red), HRP (green), and DNA (blue). (A) Visceral muscle depletion of dilp3 reduces the abundance of enteroblasts (HRP+, Su(H)+) and stem cells (HRP+, Su(H)) in 4-day fed guts. (B) Exogenous expression of dILP3 in muscle increases the abundance of enteroblasts and stem cells in 4-day fasted guts. Scale bars, 5 μm. (C-D) Cell censuses of 4-day distal hairpins. (C) In fed guts, visceral muscle knockdown of dilp3 causes ∼2-fold reduction of total cell number and decreased progenitor cell numbers. (D) In fasted guts, muscle overexpression of dilp3 causes ∼2-fold increase in total cell number and increased progenitor cell numbers. Data are means ± S.D. Total cells, p<0.0005; knockdown enteroblasts, p<0.05; overexpression enteroblasts, p<0.01. See also Supplemental Table S5. (E) The insulin pathway reporter tGPH (green) is enriched at the stem cell plasma membrane (HRP, red) under fed conditions (top) but is uniformly cytosolic under fasted conditions (bottom). DNA in blue. Right panels show enlarged views of stem cell cytoplasm. Scale bars, 2.5 μm. (F-I) dInR controls stem cell divisions downstream of feeding. (F) dInR is necessary for feeding-induced stem cell divisions. At 4 days, dinr339 clones (green; βPS integrin in red and nuclei in blue) contain only 1 cell in fed (top) and fasted (bottom) guts, while control clones (middle) contain multiple cells. Arrows and arrowheads indicate stem cells and committed daughters, respectively. (G) dInR activation is sufficient for stem cell proliferation in the absence of food. At 4 days, dinrACT clones (green) are comparably large in fed (top) and fasted (bottom) guts. Scale bar, 10 μm. (H) The size distribution of dinr339 clones in fed guts resembles control clones in fasted guts. (I) The size distribution of dinrACT clones in fasted guts resembles dinrACT clones in fed guts, even for large clones (≥5 cells; detailed in I'). See also Supplemental Table S6.
Figure 6
Figure 6. Reversal and recurrence of organ growth during a cycle of fasting and refeeding
(A) Gross size of midguts during a feed-fast-refeed cycle from 0 to 18 days. Midguts from animals raised under the following conditions: 4 days fed, 4 days fed + 7 days fasted, and 4 days fed + 7 days fasted + 7 days refed. Red lines show boundaries of distal hairpin. Scale bar, 0.5 mm. (B) Su(H)lacZ, esg>GFP midguts stained as in Figure 1E. Abundance of enteroblasts is reduced during the fasting phase compared to fed and refed phases. Scale bar, 5 μm. (C-D) Cell censuses show that total cell number (C) and enteroblast number (D) decrease during fasting and increase during refeeding. Data are means ± S.D. Total cells, p<0.02; enteroblasts, p<0.001. See also Supplemental Table S7. (E) dilp3>lacZ in midgut visceral muscle is diminished in fed-fasted guts compared to fed and refed guts. Scale bar, 100 μm. (F) Caspase activation (green, nuclei in magenta) reveals widespread apoptosis in fed-fasted guts but not fed and refed guts. Scale bars, 100 μm (top) and 5 μm (bottom). (G) Cross section of fed-fasted gut epithelium shows apical extrusion of 3 dying cells (arrowheads) positive for activated caspases (green). βPS integrin (cyan) marks the basal side of the epithelium. Scale bar, 5 μm.
Figure 7
Figure 7. Models
(A) Midgut stem cells direct an adaptive growth response. Without food (top), low dILPs result in stem cell inactivity and smaller organ size. Food ingestion (bottom) acutely upregulates midgut dILP3 and also elevates systemic dILPs. High dILPs activate stem cells to proliferate in excess of maintenance rates. Symmetric and asymmetric divisions combine to increase total cells, producing organ growth. (B) Externally-induced shifts in stem cell behavior underlie organ size metastability. Over time (x-axes), midguts acquire different numbers of cells (y-axes) based on food availability. Feeding-induced growth (solid red line) arises through increased stem cell divisions (bar height), which are predominantly symmetric (s, green bars). Non-growth states (dotted gray lines) have fewer divisions, which are predominantly asymmetric (a, brown bars). High apoptosis characterizes degrowth states (dotted red line). Irrespective of diet, a small increase in cell number occurs in new guts (solid gray line).

Comment in

References

    1. Ambrosio F, Kadi F, Lexell J, Fitzgerald GK, Boninger ML, Huard J. The effect of muscle loading on skeletal muscle regenerative potential: an update of current research findings relating to aging and neuromuscular pathology. Am J Phys Med Rehabil. 2009;88:145–155. - PMC - PubMed
    1. Amcheslavsky A, Jiang J, Ip YT. Tissue damage-induced intestinal stem cell division in Drosophila. Cell Stem Cell. 2009;4:49–61. - PMC - PubMed
    1. Apidianakis Y, Pitsouli C, Perrimon N, Rahme L. Synergy between bacterial infection and genetic predisposition in intestinal dysplasia. Proc Natl Acad Sci USA. 2009;137:3615–3624. - PMC - PubMed
    1. Biteau B, Hochmuth CE, Jasper H. JNK activity in somatic stem cells causes loss of tissue homeostasis in the aging Drosophila gut. Cell Stem Cell. 2008;3:442–455. - PMC - PubMed
    1. Biteau B, Jasper H. EGF signaling regulates the proliferation of intestinal stem cells in Drosophila. Development. 2011;138:1045–1055. - PMC - PubMed

Publication types