. 2011 Oct 28;147(3):690-703.
doi: 10.1016/j.cell.2011.08.047.

A protein complex network of Drosophila melanogaster

Affiliations

A protein complex network of Drosophila melanogaster

K G Guruharsha et al. Cell. .

Abstract

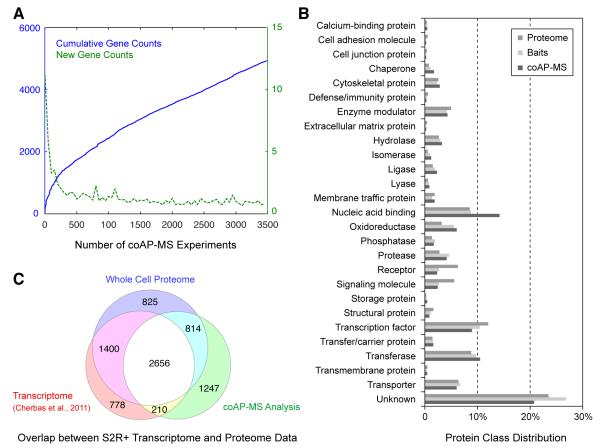
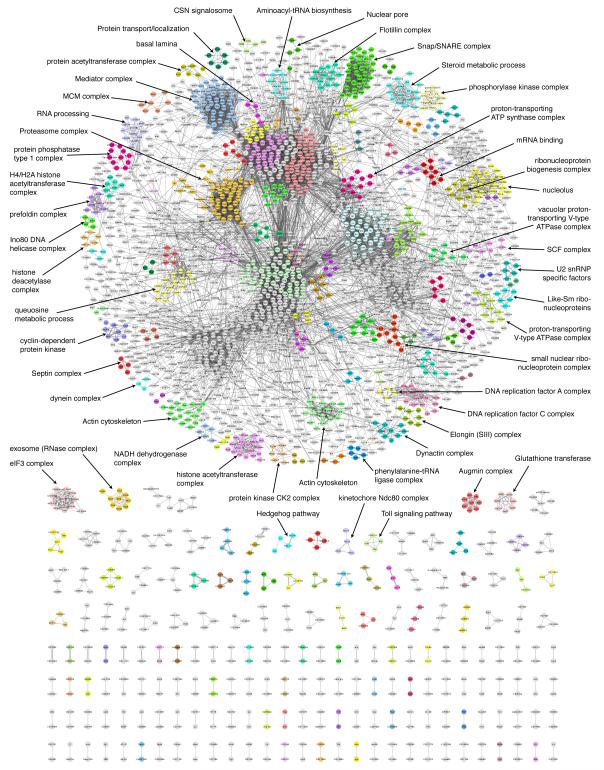
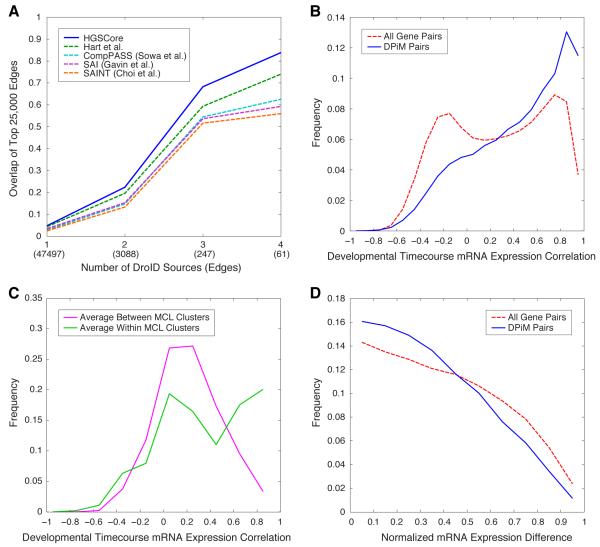
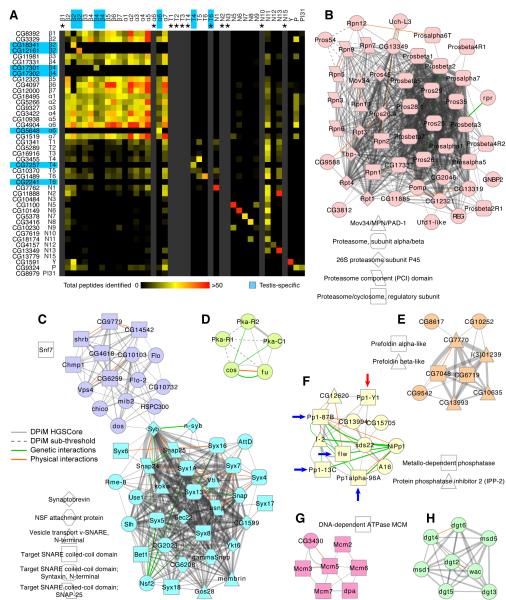
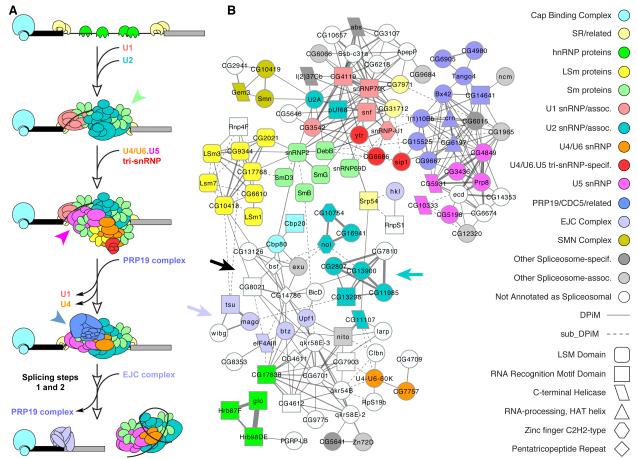
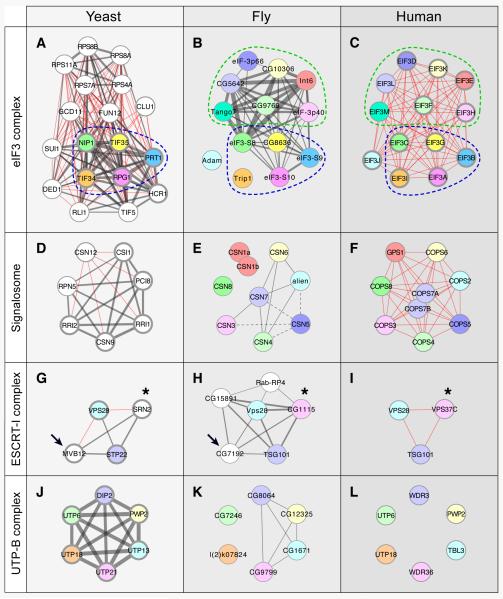
Determining the composition of protein complexes is an essential step toward understanding the cell as an integrated system. Using coaffinity purification coupled to mass spectrometry analysis, we examined protein associations involving nearly 5,000 individual, FLAG-HA epitope-tagged Drosophila proteins. Stringent analysis of these data, based on a statistical framework designed to define individual protein-protein interactions, led to the generation of a Drosophila protein interaction map (DPiM) encompassing 556 protein complexes. The high quality of the DPiM and its usefulness as a paradigm for metazoan proteomes are apparent from the recovery of many known complexes, significant enrichment for shared functional attributes, and validation in human cells. The DPiM defines potential novel members for several important protein complexes and assigns functional links to 586 protein-coding genes lacking previous experimental annotation. The DPiM represents, to our knowledge, the largest metazoan protein complex map and provides a valuable resource for analysis of protein complex evolution.


Figures

Figure 1
Figure 1. Analysis of proteins identified in the coAP-MS pipeline
(A) Cumulative number of gene counts (blue) and unique gene counts (green) detected as a function of the number of high quality affinity purification experiments. (B) Comparison of protein class distribution between Drosophila proteome, baits used and proteins identified in DPiM analysis (coAP-MS) using PANTHER (Thomas et al., 2003). (C) A conservative estimate of overlap between the S2R+ cell transcriptome [5,044 protein coding genes with gene score ≥ 300; (Cherbas et al., 2011)], S2R+ proteome whole cell lysate MS analysis (5,695 proteins) and the proteins identified in coAP-MS analysis (4,927 proteins). The intersections of the data sets are as follows: 4,056 (Transcriptome and Whole Cell Proteome), 3,470 (coAP-MS and Whole Cell Proteome) and 2,866 (Transcriptome and coAP-MS). See also Supplemental Figure S1.
Figure 2
Figure 2. Drosophila Protein interaction Map (DPiM)
Graphical representation of the DPiM comprising 10,969 high confidence co-complex membership interactions (at 0.05% FDR) involving 2,297 proteins. Protein interactions are shown as grey lines with thickness proportional to the HGSCore for the interaction in DPiM. The map defines 556 clusters, 377 of which are interconnected, representing nearly 80% of the proteins in the network. The remaining 179 clusters are not connected to members of other complexes. Depicted with different colors are 153 clusters enriched for GO terms, KEGG pathways or Pfam/Interpro domains. Proteins in other clusters that are not enriched are shown as grey circles. Selected complexes with known molecular function / biological role are indicated. See also Figure S4.
Figure 3
Figure 3. Evaluation of quality of DPiM protein interactions
(A) Comparison of interactions in the DPiM data set and DroID. Four bins with increasing levels of confidence supported by at least one, two, three, or four DroID sources were defined. The overlap between the top 25,000 interactions defined by each of the co-occurrence analysis methods and DroID is shown. The number of interactions supported by given number of sources is indicated in parentheses along the X-axis. (B) Distribution of correlation coefficients between mRNAs corresponding to interacting proteins in DPiM compared to all gene pairs, based on the RNA-Seq data (Graveley et al., 2011). (C) Distribution of correlation coefficients of mRNAs corresponding to proteins within MCL clusters compared to those between MCL clusters, analysis similar to (B). (D) Normalized absolute mRNA expression differences between DPiM interactors and all gene pairs (Cherbas et al., 2011). See also Figure S2.
Figure 4
Figure 4. Biological implications of protein complexes in DPiM
(A) Two-dimensional heat map showing the number of peptides identified for each proteasome subunit. Each column corresponds to proteins co-purified in a particular proteasome bait experiment. Grey columns (marked by asterisks) were added if a bait was unavailable. Both axes are arranged according to proteasome subunit classification, i.e., core (beta and alpha) or regulatory (base and lid). Seven testis-specific subunits are highlighted in blue. “P” refers to the Pomp protein. (B) The proteasome cluster in DPiM with subunits shaped according to Pfam/Interpro domains; circles represent nodes without domain enrichment. The thickness of the each grey line is proportional to the HGSCore of interaction. Additional physical (red lines) and genetic (green lines) evidence from literature are shown, with line thickness proportional to number of sources. (C) Clusters #7 and #162, the Snap/SNARE complex, connected by Syb to several members of Cluster #22, the Flotillin complex. (D) Cluster #117 includes proteins belonging to the Hedgehog signaling pathway. Protein Pka-R1 has interactions with HGSCores below threshold (dotted lines). (E) Cluster #42, the Prefoldin complex, all six predicted members are connected, along with three additional proteins, none of which are well studied. (F) Cluster #26, Protein Phosphatase type 1 complex has multiple genetic and physical interactions described in the literature. The known subunits PP1α87B, PP1α13C, PP1α96A and PP1β9C (blue arrows) and testis-specific subunit Pp1-Y1 (red arrow) are shown (G) Cluster #60, MCM (helicase) complex, has all six known members along with CG3430 (connected to Mcm3 and Mcm5). (H) Cluster #47, the Augmin complex, involved in mitotic spindle organization, is a standalone complex in the DPiM network. See also Figure S3 and Table S6.
Figure 5
Figure 5. Modularity of the Spliceosome subnetwork
(A) Schematic representation of step-wise interaction of snRNPs with pre-mRNA and other proteins in the process of splicing introns, as described in the literature. (B) The spliceosome subnetwork in DPiM consists of a dozen clusters that are well connected. The ~80 nodes in this subnetwork constitute a very substantial portion of the spliceosome pathway as defined in KEGG (pathway: dme03040) and (Herold et al., 2009). The major spliceosome sub-complexes are colored according to functional annotation (same as in A for comparison) and proteins are shaped according to Pfam domain enrichment. Protein interactions are shown as grey lines with thicknesses proportional to HGSCore and those with scores below the statistical cut-off are shown as dotted lines. Other proteins that are not classified as spliceosome components in KEGG or elsewhere but connected to these complexes in the DPiM network are uncolored. A majority of such non-spliceosomal proteins have “mRNA binding” annotation. The modularity of this multi-subunit molecular machinery is preserved in DPiM in the form of subnetworks that cluster together. Colored arrows and arrowheads denote complexes referred to in the text.
Figure 6
Figure 6. Examples of protein complex evolution
Comparison of four complexes defined in fly by DPiM (center panels) with yeast (left panels) and human complexes (right panels). Grey lines show physical interactions that have weighted scores and red lines show interactions implied by the curated data sets. For comparison, Inparanoid orthologs in all three species are depicted with identical colors. Proteins that do not have homologs in other species are shown in white. Complex members for which evidence exists in both high-throughput and curated datasets (yeast) or both REACTOME and CORUM databases (human) are distinguished by thicker nodes (A-C) The eIF3 complex (Cluster #24). The fly and human complexes share seven interconnected proteins (within green dotted region), which are not present in yeast. Five proteins are conserved in all three species (within blue dotted region). (D) The signalosome complex in yeast is composed of proteins sharing little sequence similarity with metazoan counterparts. The eukaryotic signalosome is composed of eight subunits (CSN1-8) as seen in the human complex (F) but CSN 1 (a and b) and CSN8 are not part of the fly signalosome in S2R+ cells. (E). ESCRT-I function is conserved from yeast to humans, but only VPS28 and STP22 in yeast and their respective fly and human orthologs are readily apparent (G-I). Additional analysis suggests a distant relationship between MVB12 in yeast and Drosophila complex member CG7192, a protein of unknown function (arrows). The yeast SRN2 also shares the Mod_r domain with CG1115 and VPS37C (asterisks). (J) The yeast UTP B complex involved in RNA processing has six well-connected members. (K) In DPiM only four members are connected but CG7246 and l(2)kO7824 are not included in the DPiM Cluster #160. (L) There is no evidence suggesting physical interaction among the complex members in human.

References

    1. Adams MD, Celniker SE, Holt RA, Evans CA, Gocayne JD, Amanatides PG, Scherer SE, Li PW, Hoskins RA, Galle RF, et al. The genome sequence of Drosophila melanogaster. Science. 2000;287:2185–2195. - PubMed
    1. Audhya A, McLeod IX, Yates JR, Oegema K. MVB-12, a fourth subunit of metazoan ESCRT-I, functions in receptor downregulation. PLoS ONE. 2007;2:e956. - PMC - PubMed
    1. Behrends C, Sowa ME, Gygi SP, Harper JW. Network organization of the human autophagy system. Nature. 2010;466:68–76. - PMC - PubMed
    1. Belote JM, Zhong L. Duplicated proteasome subunit genes in Drosophila and their roles in spermatogenesis. Heredity. 2009;103:23–31. - PubMed
    1. Bennett D, Lyulcheva E, Alphey L, Hawcroft G. Towards a comprehensive analysis of the protein phosphatase 1 interactome in Drosophila. J Mol Biol. 2006;364:196–212. - PubMed

Publication types

MeSH terms