Review
. 2012 Jan;139(1):19-37.
doi: 10.1016/j.actpsy.2011.09.014. Epub 2011 Oct 26.

Alphabetic letter identification: effects of perceivability, similarity, and bias

Affiliations
Review

Alphabetic letter identification: effects of perceivability, similarity, and bias

Shane T Mueller et al. Acta Psychol (Amst). 2012 Jan.

Abstract

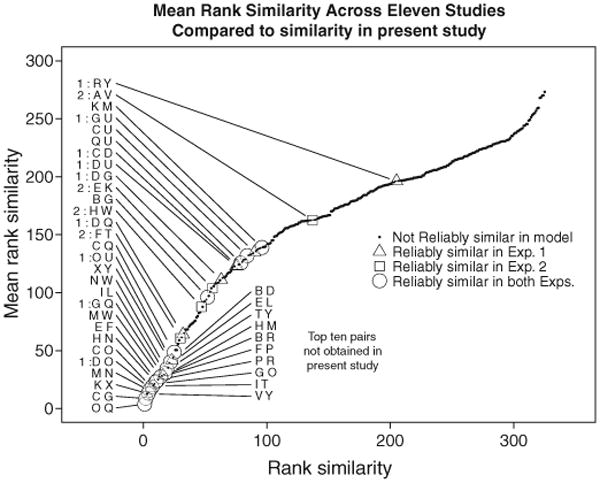
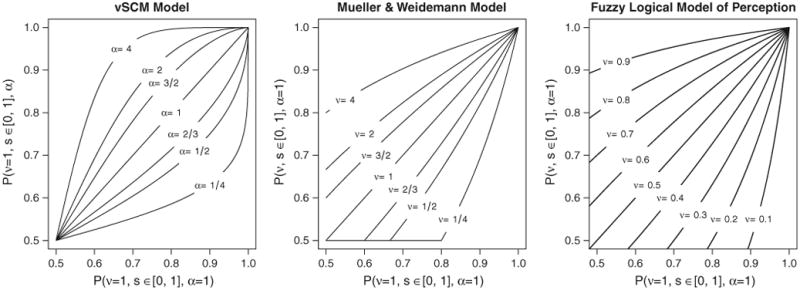
The legibility of the letters in the Latin alphabet has been measured numerous times since the beginning of experimental psychology. To identify the theoretical mechanisms attributed to letter identification, we report a comprehensive review of literature, spanning more than a century. This review revealed that identification accuracy has frequently been attributed to a subset of three common sources: perceivability, bias, and similarity. However, simultaneous estimates of these values have rarely (if ever) been performed. We present the results of two new experiments which allow for the simultaneous estimation of these factors, and examine how the shape of a visual mask impacts each of them, as inferred through a new statistical model. Results showed that the shape and identity of the mask impacted the inferred perceivability, bias, and similarity space of a letter set, but that there were aspects of similarity that were robust to the choice of mask. The results illustrate how the psychological concepts of perceivability, bias, and similarity can be estimated simultaneously, and how each make powerful contributions to visual letter identification.


Figures

Fig. 1
Fig. 1
Depiction of the stimuli and mask used in the forced-choice experiments. The “M” fills a 13-wide by 12-high pixel grid.
Fig. 2
Fig. 2
Accuracy for letter combinations in Experiment 1, for letter pairs sorted by target (top panel) or by foil (bottom panel). The gray boxes in each column depicts the 96% confidence range for each target-foil combination, using a bootstrapping process to incorporate between-participant variability in mean accuracy. Observations well outside these bounds correspond to conditions where (top) bias and similarity are strong, or (bottom) perceivability and similarity are strong. Exact values are listed in Table 2.
Fig. 3
Fig. 3
Accuracy for letter combinations in Experiment 2. Top panel shows accuracy for letter pairs sorted by target (top panel) or by foil (bottom panel). The gray boxes in each column depicts the 96% confidence range for each target-foil combination, using a bootstrapping process to incorporate between-participant variability in mean accuracy. Observations well outside these bounds correspond to conditions where (top) bias and similarity are strong, or (bottom) perceivability and similarity are strong. Exact values are listed in Table 3.
Fig. 4
Fig. 4
Predicted accuracy values for Experiment 1 (top panel) and Experiment 2 (bottom panel) based on the parameters of Model 3, found in Table 5.
Fig. 5
Fig. 5
Distribution of mean of eleven rank similarities for 325 pairs of uppercase letters, along with reliable similarity parameters identified in our study. Our model tended to identify as reliably similar pairs found by these past studies to be highly similar.
Fig. 6
Fig. 6
Comparison between the assumptions of our model and those of Rouder's (2004) vSCM, and Massaro's (1998) FLMP. In each panel, each line represents the accuracy obtained when perceivability is increased or decreased by a constant amount from 1.0, across a range of accuracies produced by manipulating similarity.

References

    1. Ashby FG, Perrin NA. Toward a unified theory of similarity and recognition. Psychological Review. 1988;95:124–150.
    1. Attneave F, Arnoult MD. The quantitative study of shape and pattern perception. Psychological Bulletin. 1956;53:452–471. - PubMed
    1. Banister H. Block capital letters as tests of visual acuity. British Journal of Ophthalmology. 1927;11:49–61. - PMC - PubMed
    1. Bell GL. Effects of symbol frequency in legibility testing. Human Factors. 1967;9(5):471–478. - PubMed
    1. Blommaert FJ. Early-visual factors in letter confusions. Spatial Vision. 1988;3(3):199–224. - PubMed

Publication types

LinkOut - more resources